Download

1 / 90
930 likes | 1.19k Vues
Blood Gases. Chris Farrell PaLMS and Laverty Pathology. Case 1. 34 man presenting with abdominal pain and vomiting for 3 days. Diabetic, has missed several doses of insulin Glucometer glucose 26.5mmol/L BP 118/80, HR 124, no respiratory distress but RR 22 Pulse oximetry 97% on RA

E N D
Blood Gases Chris Farrell PaLMS and Laverty Pathology
Case 1 • 34 man presenting with abdominal pain and vomiting for 3 days. • Diabetic, has missed several doses of insulin • Glucometer glucose 26.5mmol/L • BP 118/80, HR 124, no respiratory distress but RR 22 • Pulse oximetry 97% on RA • Is an arterial blood gas necessary or is venous ok? • Clinical approach
Case 1 • Is an arterial blood gas necessary or is venous ok? • Clinical approach • Call the laboratory!
Case 2 – today! • 31 year old man • ?Drunk • Venous sample taken pH 7.33 (7.35 – 7.45) pCO2 57 mmHg (35 – 45) HCO3- 29.3 mmol/L (24 – 32) pO2 23.0 mmHg
Outline • What information do we want from blood gas analysis? • Background statistics • Criteria for assessing performance of peripheral venous blood gas analysis • Some data • Approaches to addressing limitations of performance • Answer the phone calls?
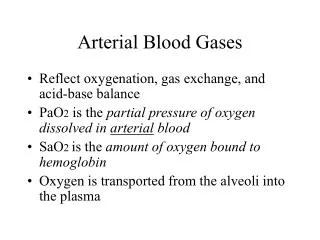
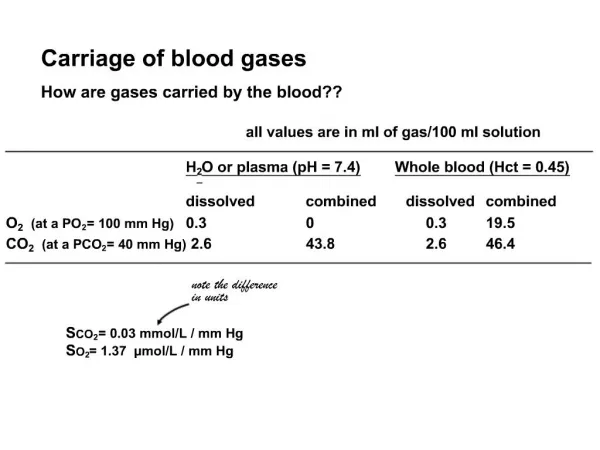
What information do we want from blood gas analysis? • Assessment of oxygenation • May also be provided by pulse oximetry in many situations • Assessment of acid-base status • Respiratory: pCO2 • Metabolic • Amount of ‘fixed acids’ in the blood • Can’t measure every fixed acid • No universally accepted measure • Measure: • Bicarbonate • Standard base excess • Strong ion difference, ATOT
All Theories Proven with One Equation Pearson’s Correlation Coefficient
All Theories Proven with One Equation Sample means
All Theories Proven with One Equation Paired observations Sample means
All Theories Proven with One Equation Paired observations Sample means Standard deviations
Data Set A r = -0.03
Data Set A-with one additional observation (100,55) r = 0.978
Bland JM & Altman DG Lancet 1986;1:307-310. • “In the analysis of measurement method comparison data, neither the correlation coefficient nor techniques such as regression analysis are appropriate. • “We suggest replacing these misleading analyses by a method that is simple both to do and to interpret. Further, the same method may be use to analyse the repeatability of a single measurement method or to compare measurements by two observers.”
Bland & Altman Lancet 1986 Comparison of 2 Peak Flow Meters r = 0.94, p < 0.001
Bland & Altman Limits of agreement -79.1 to 75.5 L/min
Bland & Altman Limits of agreement -79.1 to 75.5 L/min Average of 2 measurements used as the best estimate of the true value available
Statistics and Blood Gases –Are venous blood gases useful? • Arterial collections • Painful for patients (twice the pain of venous collection – Giner 1996) • Painful for staff • Risk of • Arterial laceration • Haematoma • Thrombosis • Infection • Venous collection • Easier • Less painful • More convenient (can be combined with collection of routine tests)
Are Venous Blood Gases Useful?-A Few Studies Saying Yes • Gokel Y, Paydas S, Koseoglu, et al. Comparison of blood gas and acid-base measurements in arterial and venous blood samples in patients with uremic acidosis and diabetic ketoacidosis in the emergency room. Am J Nephrol 2000;20:319-323. • Malatesha G, Singh NK, Bharija A, et al. Comparison of arterial and venous pH, bicarbonate, pCO2 and pO2 in initial emergency department assessment. Emerg. Med J 2007;24:569-571. • Yildizdas D, Yapicioglu H, Yilmaz HL, et al. Correlation of simultaneously obtained capillary, venous and arterial blood gases of patients in a paediatric intensive care unit. Arch Dis Child 2004;89:176-180. • McGillivray D, Ducharme FM, Charron Y, et al. Clinical decision-making based on venous versus capillary blood gas values in the well-perfused child. Ann Emerg Med 1999;34:58-63. • Kelly AM, Kerr D and Middleton P. Validation of venous pCO2 to screen for arterial hypercarbia with patients with chronic obstructive airways disease. J Emerg Med 2005;28:377-379. • Kelly AM, McALpine R, and Kyle E. Agreement between bicarbonate measured on arterial and venous blood gases. Emerg Med Austral 2004;16:407-409. • Eizadi-Mood N, Moein N and Saghaei M. Evaluation of relationship between arterial and venous blood gas values in the patients with tricyclic antidepressant poisoning. Clinical Toxicology 2005;43:357-360. • Kelly AM, Kyle E, and McAlpine R. Venous pCO2 and pH can be used to screen for significant hypercarbia in emergency patients with acute respiratory disease. Journal of Emergency Medicine 2002;22:15-19. • Rang LCF, Murray HE, Wells GA, and MacGougan CK. Can peripheral venous blood gases replace arterial blood gases in emergency department patients? Canadian Journal of Emergency Medicine 2002;4:7-15. • Brandenburg MA, Dire DJ. Comparison of arterial and venous blood gas values in the initial emergency department evaluation of patients with diabetic ketoacidosis. Annals of Emergency Medicine 1998;31:459-465. • Kelly AM, McAlpine R, and Kyle E. Venous pH can safely replace arterial pH in the initial evaluation of patients in the emergency department. Emergency Medicine Journal 2001;18:340-342.
Typical Statement • ‘Venous gas measurements accurately demonstrate the degree of acidosis in emergency department patients’ • Often based on correlation coefficient • Qualitative evaluation of the data
American Journal of Nephrology 2000 • ‘We are at this point unable to explain the moderate correlation in healthy controls, a result which apparently does not agree with the strong correlations in the patient groups.’ • ‘Venous blood samples can be used to evaluate the acid-base status in uraemic and DKA patients’ r = -0.03 r = 0.978
More Talk • ‘The arterial and venous values of pH, bicarbonate and pCO2 show acceptably narrow 95% limits of agreement.’ • No definition of acceptability, other than opinion of author (wanting to be published)
Questions • Is it surprising that blood gas parameters shows correlation in different samples from the same patient? • Is there any clinical utility in proving a correlation? • On what criteria should we base ‘adequacy’ of 95% limits of agreement?
Quality Specifications • 1. Evaluation of the effect of analytical performance on clinical outcomes in specific clinical settings • 2. Evaluation of the effect of analytical performance on clinical decisions in general: • (a) data based on components of biological variation • (b) data based on analysis of clinicians' opinions • 3. Published professional recommendations • 4. Performance goals set by • (a) regulatory bodies • (b) organisers of External Quality Assessment (EQA) schemes • 5. Goals based on the current state of the art • (a) as demonstrated by data from EQA or Proficiency Testing schemes • (b) as found in current publications on methodology.
Quality Specifications • 2(a) Data based on components of biological variation Optimum CVA <0.25 x CVI Desirable CVA <0.50 x CVI Minimum CVA <0.75 x CVI
Quality Specifications • 2(b) Data based on analysis of clinicians’ opinions • Rang 2002 n = 26 pH ±0.05 pCO2 ±6.6mmHg Bicarbonate ±3.5mmol/L
Rang 2002 n = 26 pH ±0.05 pCO2 ±6.6mmHg Bicarbonate ±3.5mmol/L Unpublished Australian data n = 46 pH ±0.10 Bicarbonate ±3mmol/L Quality Specifications2(b) Data based on analysis of clinicians’ opinions
Renal Function Testing at PaLMS • Assess excretion of ammonium chloride • Screen for partial distal RTA • Need an assessment of acid-base status at baseline and after NH4Cl
pH Correlation r = 0.71
pH Correlation r = 0.71 • Gokel • Healthy 0.771 • DKA 0.989 • Uraemia 0.979 • Bradenberg 0.97 • Gennis 0.87 • Range of arterial pH values 6.9 – 7.6
pH 95% Limits of Agreement -0.11 to 0.01
pH 95% Limits of Agreement • Gokel • -0.07 to 0.03 (Uraemia) • -0.08 to 0.00 (Control and DKA) • (derived) • Kelly • -0.11 to 0.02 • Malatesha • -0.10 to 0.13 -0.11 to 0.01 Overall weighted mean difference from 8 studies (n=1149) 0.033
2(a) ±0.01 desirable 2(a) ±0.02 minimum 2(b) ±0.05 (Rang 2002) 2(b) ±0.10 (Kelly – unpublished data) 4(b) ±0.04 Our (and others’) data ±0.06 Comparison to Quality Specifications
Comparison to Quality Specifications 2(a) ±0.01 desirable 2(a) ±0.02 minimum 2(b) ±0.05 (Rang 2002) 2(b) ±0.10 (Kelly – unpublished data) 4(b) ±0.04 Our (and others’) data ±0.06
pCO2 Correlation r = 0.41
pCO2 Correlation • Yildizas r = 0.978 • Ibrahim r = 0.838 • Gennis r = 0.81 • Range of pCO2 values 30–130mmHg r = 0.41
pCO2 95% Limits of Agreement -2.0 to 22.0 mmHg
pCO2 95% Limits of Agreement -2.0 to 22.0 mmHg • Malatesha -6.8 to 7.6 • Kelly -14 to 26 • Ibrahim -17.4 to 23.9 Weighted mean difference: COPD pts 5.7mmHg DKA 6.3mmHg
2(a) ±2.4% desirable, ie 1 at 40mmHg 2(a) ±7.2% minimum ie 3 at 40mmHg 2(b) ±3mmHg 4(b) ±8% ie 3 at 40mmHg Our (and others’) data ±12mmHg Comparison to Quality Specifications
Comparison to Quality Specifications 2(a) ±4.7% desirable, ie 2 at 40mmHg 2(a) ±7.1% minimum ie 3 at 40mmHg 2(b) ±3mmHg 4(b) ±8% ie 3 at 40mmHg Our (and others’) data ±12mmHg
Bicarbonate Correlation r = 0.85
Bicarbonate • Gokel • 0.742 (controls) • 0.995 (Uraemia) • 0.997 (DKA) • Brandenburg0.90 • Gennis 0.88 • Range of HCO3 values 9-40mmol/L r = 0.85
Bicarbonate 95% Limits of Agreement -0.8 to 5.4 mmol/L
Bicarbonate 95% Limits of Agreement -0.8 to 5.4 mmol/L • Malatesha • -4.3 to 5.8mmol/L • Kelly • -2.73 to 5.3mmol/L
Comparison to Quality Specifications • 2(a) ±0.5 mmol/L desirable • 2(a) ±0.8 mmol/L minimum • 2(b) ±3.5mmol/L (Rang) • 2(b) ±3.0mmol/L (Aussies) • 4(b) ±10%, ie 3 at 30mmol/L • Our (and others’) data • ±3.1mmol/L
2(a) ±0.5 mmol/L desirable 2(a) ±0.75 mmol/L minimum 2(b) ±3.5mmol/L (Rang) 2(b) ±3.0mmol/L (Aussies) 4(b) ±10%, ie 3 at 30mmol/L Our (and others’) data ±3.1mmol/L Comparison to Quality Specifications