Download
1 / 1
10 likes | 165 Vues
Deriving isoprene emissions for the African continent using space-based formaldehyde measurements Eloïse Marais (emarais@fas.harvard.edu) 1 , Daniel Jacob 1 , Jennifer Murphy 2 , Dylan Millet 3 , Michael Barkley 4 , Thomas Kurosu 5 , Kelly Chance 5

E N D
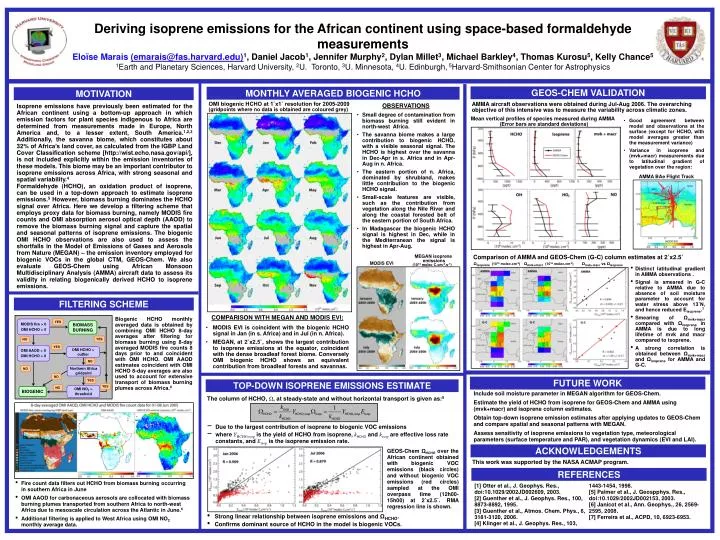
Deriving isoprene emissions for the African continent using space-based formaldehyde measurementsEloïse Marais (emarais@fas.harvard.edu)1, Daniel Jacob1, Jennifer Murphy2, Dylan Millet3, Michael Barkley4, Thomas Kurosu5, Kelly Chance5 1Earth and Planetary Sciences, Harvard University, 2U. Toronto, 3U. Minnesota, 4U. Edinburgh, 5Harvard-Smithsonian Center for Astrophysics GEOS-CHEM VALIDATION MONTHLY AVERAGED BIOGENIC HCHO MOTIVATION OMI biogenic HCHO at 1˚x1˚ resolution for 2005-2009 (gridpoints where no data is obtained are coloured grey) AMMA aircraft observations were obtained during Jul-Aug 2006. The overarching objective of this intensive was to measure the variability across climatic zones. • OBSERVATIONS • Small degree of contamination from biomass burning still evident in north-west Africa. • The savanna biome makes a large contribution to biogenic HCHO, with a visible seasonal signal. The HCHO is highest over the savanna in Dec-Apr in s. Africa and in Apr-Aug in n. Africa. • The eastern portion of n. Africa, dominated by shrubland, makes little contribution to the biogenic HCHO signal. • Small-scale features are visible, such as the contribution from vegetation along the Nile River and along the coastal forested belt of the eastern portion of South Africa. • In Madagascar the biogenic HCHO signal is highest in Dec, while in the Mediterranean the signal is highest in Apr-Aug. Isoprene emissions have previously been estimated for the African continent using a bottom-up approach in which emission factors for plant species indigenous to Africa are determined from measurements made in Europe, North America and, to a lesser extent, South America.1,2,3 Additionally, the savanna biome, which constitutes about 32% of Africa’s land cover, as calculated from the IGBP Land Cover Classification scheme [http://wist.echo.nasa.gov/api/], is not included explicitly within the emission inventories of these models. This biome may be an important contributor to isoprene emissions across Africa, with strong seasonal and spatial variability.4 Formaldehyde (HCHO), an oxidation product of isoprene, can be used in a top-down approach to estimate isoprene emissions.5 However, biomass burning dominates the HCHO signal over Africa. Here we develop a filtering scheme that employs proxy data for biomass burning, namely MODIS fire counts and OMI absorption aerosol optical depth (AAOD) to remove the biomass burning signal and capture the spatial and seasonal patterns of isoprene emissions. The biogenic OMI HCHO observations are also used to assess the shortfalls in the Model of Emissions of Gases and Aerosols from Nature (MEGAN) – the emission inventory employed for biogenic VOCs in the global CTM, GEOS-Chem. We also evaluate GEOS-Chem using African Monsoon Multidisciplinary Analysis (AMMA) aircraft data to assess its validity in relating biogenically derived HCHO to isoprene emissions. Mean vertical profiles of species measured during AMMA (Error bars are standard deviations) • Good agreement between model and observations at the surface (except for HCHO, with model averages greater than the measurement variance) • Variance in isoprene and (mvk+macr) measurements due to latitudinal gradient of vegetation over the region: AMMA BAe Flight Track Comparison of AMMA and GEOS-Chem (G-C) column estimates at 2˚x2.5˚ MEGAN isoprene emissions (1012molecC.cm-2.s-1) MODIS EVI Ωisoprene (1015 molec.cm-2) Ωmvk+macr(1015 molec.cm-2) Ωmvk+macrvsΩisoprene • Distinct latitudinal gradient in AMMA observations . • Signal is smeared in G-C relative to AMMA due to absence of soil moisture parameter to account for water stress above 13˚N, and hence reduced Eisoprene.7 • Smearing of Ωmvk+macr compared with Ωisoprene in AMMA is due to long lifetime of mvk and macr compared to isoprene. • A strong correlation is obtained between Ωmvk+macr and Ωisoprene for AMMA and G-C. FILTERING SCHEME • COMPARISON WITH MEGAN AND MODIS EVI: • MODIS EVI is coincident with the biogenic HCHO signal in Jan (in s. Africa) and in Jul (in n. Africa). • MEGAN, at 2˚x2.5˚, shows the largest contribution to isoprene emissions at the equator, coincident with the dense broadleaf forest biome. Conversely OMI biogenic HCHO shows an equivalent contribution from broadleaf forests and savannas. Biogenic HCHO monthly averaged data is obtained by combining OMI HCHO 8-day averages after filtering for biomass burning using 8-day averaged MODIS fire counts 8 days prior to and coincident with OMI HCHO. OMI AAOD estimates coincident with OMI HCHO 8-day averages are also used to account for extensive transport of biomass burning plumes across Africa.6 YES MODIS fire > 0 OMI HCHO > 0 BIOMASS BURNING YES NO YES OMI AAOD > 0 OMI HCHO > 0 OMI HCHO > outlier NO Northern Africa gridpoint NO NO FUTURE WORK YES TOP-DOWN ISOPRENE EMISSIONS ESTIMATE YES NO OMI NO2 > threshold BIOGENIC Include soil moisture parameter in MEGAN algorithm for GEOS-Chem. Estimate the yield of HCHO from isoprene for GEOS-Chem and AMMA using (mvk+macr) and isoprene column estimates. Obtain top-down isoprene emission estimates after applying updates to GEOS-Chem and compare spatial and seasonal patterns with MEGAN. Assess sensitivity of isoprene emissions to vegetation type, meteorological parameters (surface temperature and PAR), and vegetation dynamics (EVI and LAI). The column of HCHO, Ω, at steady-state and without horizontal transport is given as:5 • Due to the largest contribution of isoprene to biogenic VOC emissions • where YHCHO,isop is the yield of HCHO from isoprene, kHCHO and kisop are effective loss rate constants, and Eisop is the isoprene emission rate. ACKNOWLEDGEMENTS GEOS-ChemΩHCHOover the African continentobtained with biogenic VOC emissions (black circles) and without biogenic VOC emissions (red circles) sampled at the OMI overpass time (12h00-15h00) at 2˚x2.5˚. RMA regression line is shown. This work was supported by the NASA ACMAP program. REFERENCES • Fire count data filters out HCHO from biomass burning occurring in southern Africa in June • OMI AAOD for carbonaceous aerosols are collocated with biomass burning plumes transported from southern Africa to north-west Africa due to mesoscale circulation across the Atlantic in June.6 • Additional filtering is applied to West Africa using OMI NO2 monthly average data. [1] Otter et al., J. Geophys. Res., doi:10.1029/2002JD002609, 2003. [2] Guenther et al., J. Geophys. Res., 100, 8873-8892, 1995. [3] Guenther et al., Atmos. Chem. Phys., 6, 3181-3120,2006. [4] Klinger et al., J. Geophys. Res., 103, 1443-1454, 1998. [5] Palmer et al., J. Geospphys. Res., doi:10.1029/2002JD002153, 2003. [6] Janicot et al., Ann. Geophys., 26, 2569-2595, 2008. [7] Ferreira et al., ACPD, 10, 6923-6953. • Strong linear relationship between isoprene emissions and ΩHCHO. • Confirms dominant source of HCHO in the model is biogenic VOCs.