Download
1 / 22
220 likes | 225 Vues
Learn how to identify and graph quadratic functions using tables of values and the standard form of the equation. Find the direction of the parabola and determine the vertex and range.

E N D
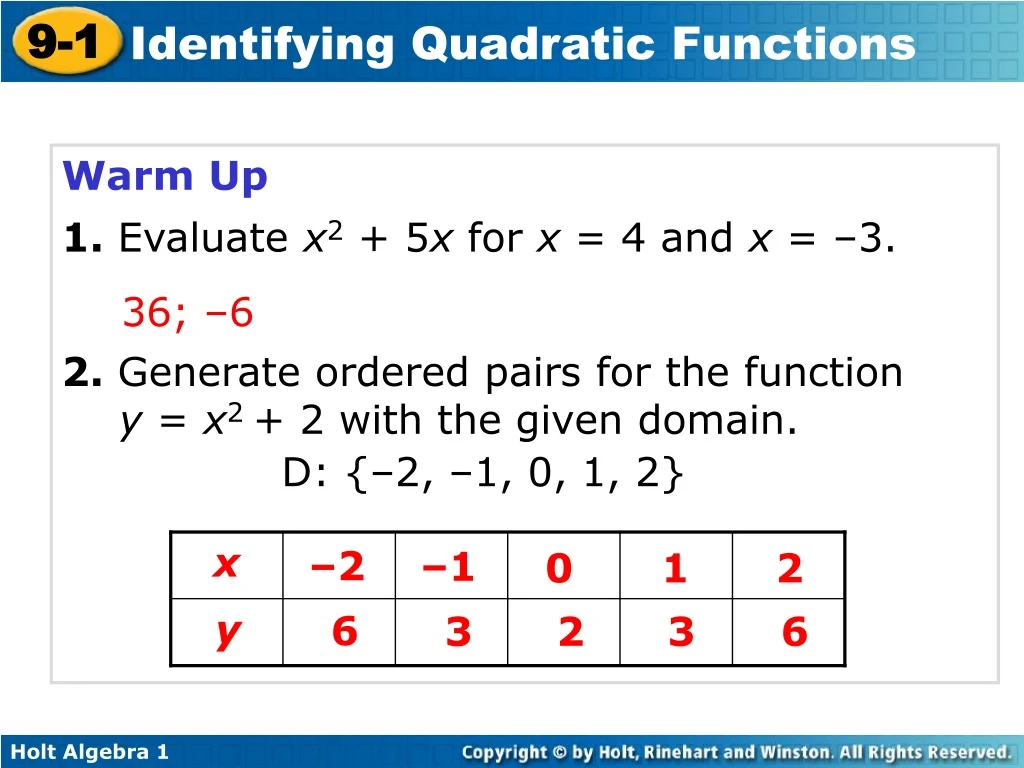
x –2 –1 0 1 2 y 6 3 2 3 6 • Warm Up • 1. Evaluate x2 + 5x for x = 4 and x = –3. 36; –6 2. Generate ordered pairs for the function y = x2 + 2 with the given domain. D: {–2, –1, 0, 1, 2}
9-1 Identifying Quadratic Functions Holt Algebra 1
The function y = x2 is shown in the graph. Notice that the graph is not linear. A quadratic function is any function that can be written in the standard form y = ax2 + bx + c, where a, b, and c are real numbers and a ≠ 0. The function y = x2 can be written as y = 1x2 + 0x + 0, where a = 1, b = 0, and c = 0.
Notice that the quadratic function y = x2 has constant second differences.
Example 1A: Identifying Quadratic Functions Tell whether the function is quadratic. Explain. Since you are given a table of ordered pairs with a constant change in x-values, see if the second differences are constant. x y –2 –9 +1 +1 +1 +1 +7 +1 +1 +7 –6 +0 +6 –1 –2 0 –1 Find the first differences, then find the second differences. 1 0 2 7 The function is not quadratic. The second differences are not constant.
Example 1B: Identifying Quadratic Functions Tell whether the function is quadratic. Explain. Since you are given an equation, use y = ax2 + bx+ c. y = 7x + 3 This is not a quadratic function because the value of a is 0.
y – 10x2 = 9 + 10x2 +10x2 y = 10x2 + 9 Example 1C: Identifying Quadratic Functions Tell whether the function is quadratic. Explain. y – 10x2 = 9 Try to write the function in the form y = ax2 + bx + c by solving for y. Add 10x2 to both sides. This is a quadratic function because it can be written in the form y = ax2 + bx + c where a = 10, b = 0, and c =9.
The graph of a quadratic function is a curve called a parabola.
x y –2 –16 –1 –4 0 0 1 –4 2 –16 Example 2B: Graphing Quadratic Functions by Using a Table of Values Use a table of values to graph the quadratic function. y = –4x2 Make a table of values. Choose values of x and use them to find values of y. Graph the points. Then connect the points with a smooth curve.
x y –2 6 –1 3 0 2 1 3 2 6 Check It Out! Example 2a Use a table of values to graph each quadratic function. y = x2 + 2 Make a table of values. Choose values of x and use them to find values of y. Graph the points. Then connect the points with a smooth curve.
When a quadratic function is written in the form y = ax2 + bx + c, the value of a determines the direction a parabola opens. • A parabola opens upward when a > 0. • A parabola opens downward when a < 0.
Write the function in the form y = ax2 + bx + c by solving for y. Add to both sides. Example 3A: Identifying the Direction of a Parabola Tell whether the graph of the quadratic function opens upward or downward. Explain. Identify the value of a. Since a> 0, the parabola opens upward.
Example 3B: Identifying the Direction of a Parabola Tell whether the graph of the quadratic function opens upward or downward. Explain. y = 5x – 3x2 Write the function in the form y = ax2 + bx + c. y = –3x2 + 5x a = –3 Identify the value of a. Since a< 0, the parabola opens downward.
The highest or lowest point on a parabola is the vertex. If a parabola opens upward, the vertex is the lowest point. If a parabola opens downward, the vertex is the highest point.
A. B. Identify the vertex of each parabola. Then give the minimum or maximum value of the function. The vertex is (–3, 2), and the minimum is 2. The vertex is (2, 5), and the maximum is 5.
a. b. Check It Out! Example 4 Identify the vertex of each parabola. Then give the minimum or maximum value of the function. The vertex is (–2, 5) and the maximum is 5. The vertex is (3, –1), and the minimum is –1.
For the graph of y = x2 – 4x + 5, the range begins at the minimum value of the function, where y = 1. All the y-values of the function are greater than or equal to 1. So the range is y 1.
Example 5: Finding Domain and Range Find the domain and range. Step 1 The graph opens downward, so identify the maximum. The vertex is (–5, –3), so the maximum is –3. Step 2 Find the domain and range. D: all real numbers R: y ≤ –3
Lesson Quiz: Part I 1. Is y = –x – 1quadratic?Explain. 2. Graph y = 1.5x2. No; there is no x2-term, so a = 0.
Lesson Quiz: Part II Use the graph for Problems 3-5. 3. Identify the vertex. 4. Does the function have a minimum or maximum? What is it? 5. Find the domain and range. (5, –4) max; –4 D: all real numbers; R: y ≤ –4