Download
1 / 9
90 likes | 158 Vues
C HAPTER. The Phillips Curve and Expectations Theory. 27. T HE T HEORETICAL R ELATIONSHIP BETWEEN C HANGES IN A GGREGATE D EMAND AND THE P HILLIPS C URVE. EXHIBIT 1. T HE P HILLIPS C URVE FOR THE U NITED S TATES IN THE 1960 S. EXHIBIT 2.

E N D
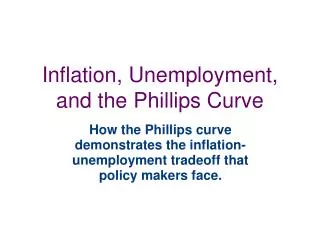
CHAPTER The Phillips Curve and Expectations Theory 27
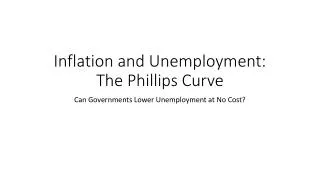
THE THEORETICAL RELATIONSHIP BETWEEN CHANGES IN AGGREGATE DEMAND AND THE PHILLIPS CURVE EXHIBIT 1
THE PHILLIPS CURVE FOR THE UNITED STATES IN THE 1960S EXHIBIT 2 Source: Economic Report of the President, 2004, http://www.gpo.access.gov/eop/index.html, Tables B-35 and B-64.
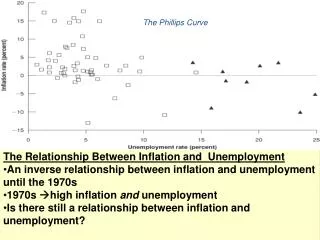
INFLATION AND UNEMPLOYMENT RATES FOR THE UNITED STATES, 1970–2003 EXHIBIT 3 Source: Economic Report of the President, 2004,http://www.gpo.access.gov/eop/index.html, Tables B-35 and B-64.
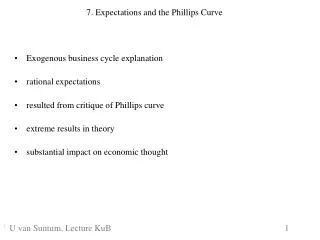
EXHIBIT 4 THE SHORT-RUN AND LONG-RUN PHILLIPS CURVES
MONEY SUPPLY GROWTH AND PRESIDENTIAL ELECTIONS, 1960–2000 EXHIBIT 5 Source: Economic Report of the President, 2004, http://www.gpo.access.gov/eop/index.html.
ADAPTIVE EXPECTATIONS VERSUS RATIONAL EXPECTATIONS EXHIBIT 6
HOW DIFFERENT MACROECONOMIC MODELS CURE INFLATION (Continued) EXHIBIT 7