Download
1 / 18
190 likes | 500 Vues
The Phillips Curve. The relationship between inflation and unemployment. The Phillips Curve. Based on the work of a New Zealand economist, the Phillips curve presents a relationship between the rate of inflation and the unemployment rate.

E N D
The Phillips Curve The relationship between inflation and unemployment
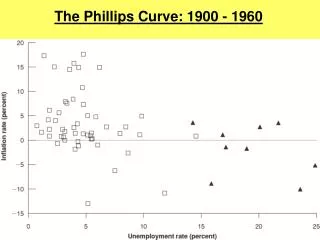
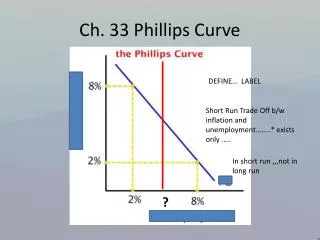
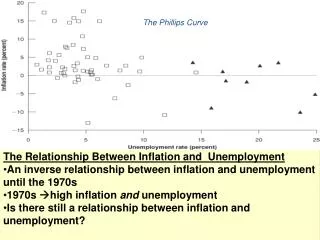
The Phillips Curve • Based on the work of a New Zealand economist, the Phillips curve presents a relationship between the rate of inflation and the unemployment rate. • The Phillips curve argues that there is an inverse relationship between the two economic statistics.
The Phillips Curve According to the theory, economic policymakers would have to choose between either high unemployment or high rates of inflation
AD and the Phillips curve It was argued that changes in AD would lead to either an increasing price level and lower unemployment rates, or a decreasing price level and higher unemployment rates
The Phillips Curve in the 1960s • Economic policy makers seemed to accept the validity of the Phillips curve through the 1960s, as aggregate supply was relatively stable. • As Keynesian thinking was widely accepted, economists reasoned that by influencing the level of aggregate demand in the economy, they could simply choose either high inflation with low unemployment or low inflation with high unemployment.
The Phillips Curve in the 1970s • Negative supply-shocks of the 1970s, especially those caused by OPEC’s reduction of oil output and world crop failures led to large increases in the price of oil and food. • All of a sudden, aggregate supply didn’t seem so stable anymore
Stagflation • The negative supply shocks led to both an increasing price level and less output (more unemployment). This contradicted the idea behind the Phillips curve, which said you would only have one negative situation. • These events led to the idea of the Phillips curve shifting upwards….
Short-run vs. Long-run • Friedman argued that the trade-off between the rate of inflation and the unemployment rate was only a temporary situation. He made a distinction between a short-run Phillips curve and a long-run Phillips curve.
Short-run Phillips curve • Friedman accepted the idea of an inverse relationship between the rate of inflation and the unemployment rate in the short-run, as Phillips originally argued.
Long-run Phillips curve • Friedman dismissed the trade-off between the inflation rate and the unemployment rate in the long-run. He argued that the long-run Phillips curve is a vertical line at the “natural rate of unemployment”. As a neo-classicist, Friedman argued that increases in AD would lead to an increase in output (less unemployment) and higher average prices, but in the long-run, the gains in output would be offset by a leftward shift of the SRAS curve
So according to Friedman.. • The government can only lower unemployment rates in the short run using aggregate demand policies, and this will come with an increasing price level. • In the long-run, the unemployment rate will return to the natural rate, and this can only be lowered using the supply-side policies you know so well….