Download
1 / 54
1.06k likes | 2.5k Vues
Hydrology and Water Resources RG744. PRECIPITATION. Precipitation . Any form of solid and liquid water that falls from atmosphere to earth surface Rain, drizzle, hail, dew, snow. Types of Precipitation. The precipitation types can be categorized as Frontal Precipitation

E N D
Hydrology and Water Resources RG744 PRECIPITATION RS & GISc, Institute of Space Technology
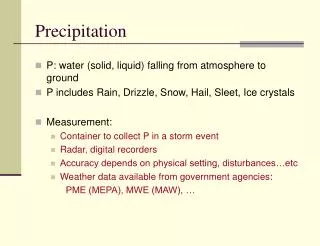
Precipitation • Any form of solid and liquid water that falls from atmosphere to earth surface • Rain, • drizzle, • hail, • dew, • snow
Types of Precipitation • The precipitation types can be categorized as • Frontal Precipitation • The formation of precipitation due to the convergence of two air masses with contrasting temperature and densities • Convective Precipitation • Upward movement of warm air with low density than its surrounding air rises till it reaches to a level where it has the temperature of its environment. The temperature contrast causes convection and cools adiabatically and clouds are made that burst into thunderstorm • Convective storms are generally known as thunderstorms • Orographic Precipitation • Uplift of an air mass because of a topographic obstruction. • Uplift also causes the cooling of the air mass. If enough cooling occurs condensation can occur and form into orographic precipitation
Cyclonic Precipitation • Air mass that converges into a low pressure area moves up due to difference in pressure and winds blow spirally inward • Precipitation due to Turbulent Ascent • Condensation of air mass that moves up due to increased turbulence and friction of earth surface after its travel over ocean
Measurement of Precipitation • Total amount (depth) over some time period (hourly, daily, monthly, seasonally, or annually) • Problems: • Many records are not available for rural areas • Discontinuous or short term
Methods of Measurement • Rain gauges • Radar (Radio Detection and Ranging) • Weather Satellites
Rain Gauges • Symon’s (non-recording) Type • Weighing Bucket Type (mass curve) • Tipping Bucket • Siphon or Floating Gauge • Storage Rain Gauge (for remote areas) • Telemetring Rain Gauge (inaccessible places) • Automatic Radio Reporting Gauge
Selection of Rain Gauge Site? • Open space • Least obstructions • Distance between gauge and the nearest object should be at least twice the height of the object • On leveled ground (slopes are not recommended) • In hilly areas if level ground is not available, place at top of the hill • Shield from high wind • If fence is provided then it should not be less than twice its height
Adequacy of Rainfall Station • A well distributed network is essential • Statistical Analysis • To give necessary average rainfall with certain % Error • Number of stations required for a given area • How to estimate? (Reference: Hydrology by Das & Saikia)
World Meteorological Organization (WMO) Recommendations • Flat regions of temperate, Mediterranean and tropical zones • Ideal – 1 station for 600-900 sq.km. • Acceptable – 1 station for 900-3,000 sq.km. • Mountainous regions of temperate, Mediterranean and tropical zones • Ideal – 1 station for 100-250 sq.km. • Acceptable – 1 station for 250-1,000 sq.km. • Arid and polar zones • Ideal – 1 station for 1,500-10,000 sq.km. Depending on the feasibility. • 10% of rain gauge stations should be equipped with self recording rain gauges
Bureau of Indian Standards (BIS) Recommendations • In plains • 1 station for every 520sq.km. • In regions with average elevation of 1,000m or above from mean sea level • 1 station per 260-390 sq.km. • In hilly areas with heavy rainfall • 1 station for every 130 sq.km.
Radar Measurement • Weather radar detects, measure and locates precipitation • Usually used to supplement gauge data • Radar signals reflected by rain • Determine magnitude and areal distribution • Sending microwave signals and listening for return signals • Timings of return signals give range of an object • The amount of energy reflected back to the radar is proportional to the precipitation intensity
Weather satellites • Used to monitor weather and climate of the Earth • Can provide useful information on rainfall distribution over large areas and inaccessible regions • Direct measurement of rainfall from satellites is not feasible because the presence of clouds
Weather satellites • Provide information only about the cloud tops rather than cloud bases or interiors Examples • Polar orbiting • NOAA-N series • Geostationary • GOES (operated by the United States National Environmental Satellite) • GMS (by the Japan Meteorological Agency), and • Meteosat
Analysis of Precipitation • Mean Rainfall • Estimating Missing data • Double Mass Analysis • Frequency Analysis • Depth Area Duration Curve • Rainfall Hyetographs • Intensity Duration Frequency Curve • Frequency (IDF) Curves
Calculation of Mean Watershed Precipitation • Arithmetic Method • Thiessen Polygon Method • Isohyetal Method
Arithmetic Method • Simplest Method • Where: • Pm = Average Rainfall in the catchment • n = number of rain gauge stations • P1, P2, ….. Pn= Recorded rain at station 1, 2, ….n respectively in a given period • Limitations????
Thiessen Polygon Method • Tries to eliminate the error due to non-uniformity of rain gauge distribution • Suggested by A. M. Thiessen in 1911 A1, A2,…..A6 = polygon areas
Thiessen Polygon Method Steps: • Join stations by line • Draw perpendicular bisector of these lines • The perpendicular bisector produces polygons called Thiessen polygons • Calculate average rainfall of the area • P1, P2….. =rainfall in stations 1, 2….
Isohyetal Method • More accurate than other methods • Location and precipitation are plotted • Contours of equal precipitation called Isohyets are drawn • Calculate area between successive isohyets • The equivalent uniform depth of precipitation between isohyets is assumed to be equal to the median value of two isohyets
Adjustment for Missing Data • If rain gauge data at 1 or 2 stations is missing • Interpolation in the estimation of average rainfall • Data from neighboring stations is used • ‘Normal Rainfall’ used as a standard for comparison • ‘Normal Rainfall’ is the average value of rainfall at a particular date, month or year over a specified 30-year period.
Estimating Point Rainfall at a given Location • Interpolation • From recorded values at surrounding sites • Arithmetic Mean Method • Inverse distance square • Normal Ratio Method • Station Year Method • Double Mass Curve
Arithmetic Mean Method • Break in station data • Requires data from at least 3 other stations (evenly distributed) close to that station • Normal preciptitation at other stations should be within 10% of precipitation at that station • PA, PB, PC = Precipitation at nearby stations • Px= Estimated precipitation of the missing station
Inverse Distance • From recorded values at surrounding sites • Based on weighted average of surrounding values • The weights are reciprocals of the sum of square of distances D, measured from the point of interest
Normal Ratio Method • When normal annual precipitation of nearby stations ( NA, NB, NC, ..) differs more than 10% of that of the station (Nx) with missing data • N= Normal Precipitation
Station Year Method • Record of 2 or more independent stations are combined • Area of these stations should be climatologically same • Missing record at certain station in particular year is found by ratio of the average PA2000/PA1999 = PB2000/PB1999
Double Mass Analysis • For checking the consistency of a station against one or more nearby stations • Consider a station E collecting data for 45 years • For some reasons, the catch of the station is affected • There are other stations H and I with same storm patterns though their annual rainfall differ • Check for a consistent correlation between the averages of H and I and that of E in early years • Plot the accumulated annual rainfall at E against the accumulated average annual rainfall at H and I • Correct the existing rainfall catch at E when the relationship changes against the previous relationship
Rain-Gauge Data Spatial Interpolation • When interpolation methods are appropriate? • when an attribute measured at sample points is a spatially continuous field variable • Involves estimating the rainfall values at unmeasured points
Spatial Interpolation Methods • Nearest neighbor (Thiessen Polygon Method ) • Isohyetal • Triangulation • Distance weighting • Krigging
Triangulation • Joining of adjacent data points by a line to form a lattice of triangles (TIN) • Values at any intermediate point on the surface can be computed through trigonometry
Distance weighting • Moving-average procedure using points within a specified zone of influence • Example: Inverse distance weighting • weights are inversely proportional to the square of the distance between the point of interest and each of the data points
Kriging • Also based on a weighted sum of the points within a zone of influence • weights in kriging are determined from a set of n simultaneous linear equations, where n is the number of points used for the estimation • Based on spatial correlation • points closer together tend to be strongly correlated, whereas those far apart lack correlation
PRISM? • Parameter-elevation Regressions on Independent Slopes Model • Expert system that uses point data and a digital elevation model (DEM) to generate gridded estimates of climate parameters • Developed to overcome the deficiencies of standard spatial interpolation methods, where orographic effects strongly influence weather patterns • PRISM has been used to map temperature, snowfall, weather generator statistics, and others • Uses DEM
PRISM (conti..) • For each DEM grid cell, PRISM develops a weighted precipitation/elevation (P/E) regression function from nearby stations, and predicts precipitation at the cell’s DEM elevation with this function • In the regression, greater weight is given to stations with locations, elevations, and topographic positionings similar to that of the grid cell • Whenever possible, PRISM calculates a prediction interval for the estimate, which is an approximation of the uncertainty involved.
Hyetograph, Mass Curve and Hydrograph • Hyetograph is the graphical plot of the rainfall plotted against time • Mass Curve of rainfall is a plot of accumulated rainfall against time • Hydrograph is a plot of discharge in the channel vs. time (cubic feet per second) • Hydrograph after separating the base flow is called Direct Runoff Hydrograph
Plotting a Hyetograph Area under hyetograph represents the total rainfall received in the period