Download
1 / 1
10 likes | 139 Vues
Web-Homework Platforms : Measuring Student Efforts in Relationship to Achievement Michael J. Krause. INTRODUCTION Since the 2007 fall semester, I have used web-based accounting textbook homework platforms with two

E N D
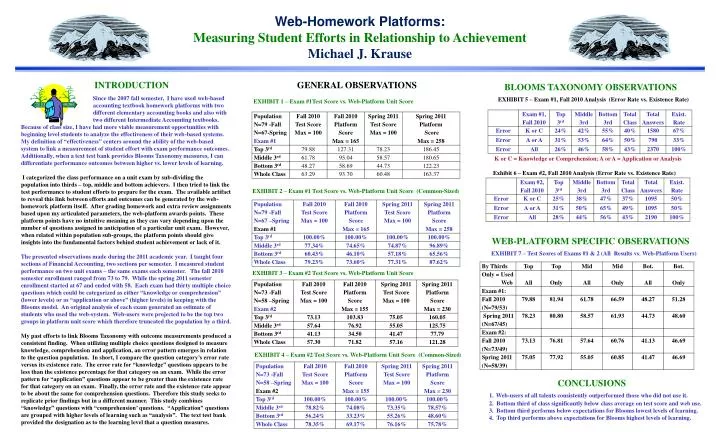
Web-Homework Platforms: Measuring StudentEfforts in Relationship to Achievement Michael J. Krause INTRODUCTION Since the 2007 fall semester, I have used web-based accounting textbook homework platforms with two different elementary accounting books and also with two different Intermediate Accounting textbooks. Because of class size, I have had more viable measurement opportunities with beginning level students to analyze the effectiveness of their web-based systems. My definition of “effectiveness” centers around the ability of the web-based system to link a measurement of student effort with exam performance outcomes. Additionally, when a text test bank provides Blooms Taxonomy measures, I can differentiate performance outcomes between higher vs. lower levels of learning. I categorized the class performance on a unit exam by sub-dividing the population into thirds – top, middle and bottom achievers. I then tried to link the test performance to student efforts to prepare for the exam. The available artifact to reveal this link between efforts and outcomes can be generated by the web-homework platform itself. After grading homework and extra review assignments based upon my articulated parameters, the web-platform awards points. These platform points have no intuitive meaning as they can vary depending upon the number of questions assigned in anticipation of a particular unit exam. However, when related within population sub-groups, the platform points should give insights into the fundamental factors behind student achievement or lack of it. The presented observations made during the 2011 academic year. I taught four sections of Financial Accounting, two sections per semester. I measured student performance on two unit exams – the same exams each semester. The fall 2010 semester enrollment ranged from 73 to 79. While the spring 2011 semester enrollment started at 67 and ended with 58. Each exam had thirty multiple choice questions which could be categorized as either “knowledge or comprehension” (lower levels) or as “application or above” (higher levels) in keeping with the Blooms model. An original analysis of each exam generated an estimate of students who used the web-system. Web-users were projected to be the top two groups in platform unit score which therefore truncated the population by a third. My past efforts to link Blooms Taxonomy with outcome measurements produced a consistent finding. When utilizing multiple choice questions designed to measure knowledge, comprehension and application, an error pattern emerges in relation to the question population. In short, I compare the question category’s error rate versus its existence rate. The error rate for “knowledge” questions appears to be less than the existence percentage for that category on an exam. While the error pattern for “application” questions appear to be greater than the existence rate for that category on an exam. Finally, the error rate and the existence rate appear to be about the same for comprehension questions. Therefore this study seeks to replicate prior findings but in a different manner. This study combines “knowledge” questions with “comprehension’ questions. “Application” questions are grouped with higher levels of learning such as “analysis”. The text test bank provided the designation as to the learning level that a question measures. GENERAL OBSERVATIONS EXHIBIT 1 – Exam #1Test Score vs. Web-Platform Unit Score BLOOMS TAXONOMY OBSERVATIONS EXHIBIT 5 – Exam #1, Fall 2010 Analysis (Error Rate vs. Existence Rate) K or C = Knowledge or Comprehension; A or A = Application or Analysis Exhibit 6 – Exam #2, Fall 2010 Analysis (Error Rate vs. Existence Rate) EXHIBIT 2 – Exam #1 Test Score vs. Web-Platform Unit Score (Common-Sized) WEB-PLATFORM SPECIFIC OBSERVATIONS EXHIBIT 7 – Test Scores of Exams #1 & 2 (All Results vs. Web-Platform Users) EXHIBIT 3 – Exam #2 Test Score vs. Web-Platform Unit Score EXHIBIT 4 – Exam #2 Test Score vs. Web-Platform Unit Score (Common-Sized) CONCLUSIONS 1.Web-users of all talents consistently outperformed those who did not use it. 2. Bottom third of class significantly below class average on test score and web use. 3. Bottom third performs below expectations for Blooms lowest levels of learning. 4. Top third performs above expectations for Blooms highest levels of learning.