Download
1 / 80
810 likes | 1.04k Vues
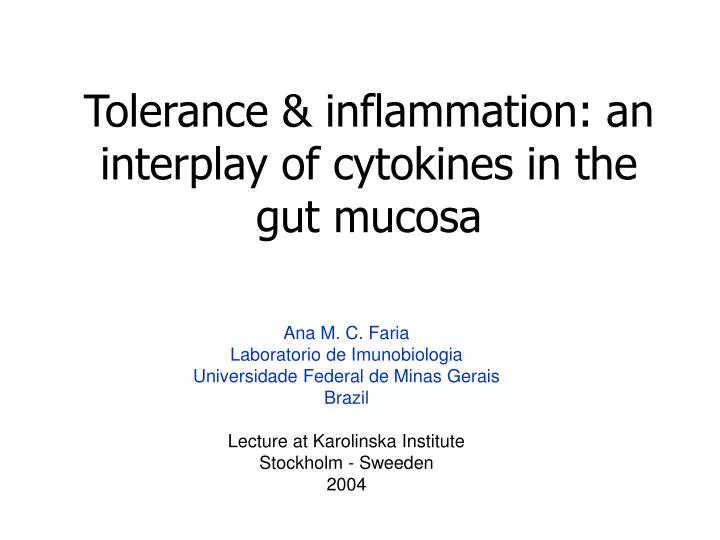
Tolerance & inflammation: a n interplay of cytokines in the gut mucosa. Ana M. C. Faria Laboratorio de Imunobiologia Universidade Federal de Minas Gerais Brazil Lecture at Karolinska Institute Stockholm - Sweeden 2004. Gut mucosa.

E N D
Tolerance & inflammation: an interplay of cytokines in the gut mucosa Ana M. C. Faria Laboratorio de Imunobiologia Universidade Federal de Minas Gerais Brazil Lecture at Karolinska Institute Stockholm - Sweeden 2004
Gut mucosa Most contact with foreign antigens occur at the gut mucosa The total area of the gut mucosa is 300 m2, 100-fold larger than that of the skin Approximately 30 kg of food reaches the human intestine per year and 130-190 g are absorbed daily in the gut The number of bacteria colonizing the human large intestine is 1012 /g of stool The gut mucosa lodges the largest collection of lymphoid tissue in the body. Most of the B and T cells in the gut are activated producing immunoglobulins (IgA) and cytokines (IFN-g, IL-1, IL-4, IL-10, TGF-b) In spite of the activated state of mucosal lymphoid cells, the most commom result of antigen exposure by oral route is oral tolerance rather than inflammatory responses.
Tolerância oral . . Induced in the gut Systemic effects Stimulation Gut mucosa Regulatory mechanisms Oral tolerance Immunization Immunological activity Feeding Cellular response Antibody response saline Ova Ova Ova
Oral tolerance First described in 1909 by A. Besredka and in 1911 by H.G. Wells Study of immunological mechanisms involved started in the 70’s (Vaz, Mowat, Challacombe, Tomasi and others) All protein antigens tested so far can induce oral tolerance and animals are normally tolerant to their diet and their microbiota In the 1980’s, it has been shown to be an effective mean of inhibiting immune respoonses to antigens of immunopathological importance in animals including type II collagen and myelin basic protein (Nagler-Anderson, Thompson & Staines, Weiner, Whitacre). In the 1990s, oral tolerance was then applied for the treatment of human diseases (Weiner) and there currently several trials using target proteins in different autoimmune conditions such as diabetes, multiple sclerosis, rheumatoid arthritis.
Intestinal milieu CD45RBlo CD44hi CD62Lloa4b7hi Antigen APC APC IL-4, IL-10, TGF- PGE-2 HEV SLC MIP
macrophage dendritic cell Main APCs in the gut mucosa
OVA oral or nasal Saline oral or nasal OVA + CFA OVA + Al(OH)3 7 days 7 days 14 days 14 days Proliferation Cytokines Induction of mucosal tolerance Mucosa is a priviledged site for tolerance induction Oral x nasal tolerance DTH Antibody production
Proliferation Oral 20mg x5 160000 Nasal 2mg x5 140000 120000 100000 Delta CPM 80000 60000 40000 20000 0 Control Nasal Oral IgG1 IgE 3000 1600 1400 2500 1200 2000 1000 O.D. (492 nm) 800 1500 600 1000 400 500 200 0 0 Control Oral Nasal Control Oral Nasal Oral x nasal tolerance Ova + CFA OVA + Al(OH)3
IFN-g IL-2 7000 300 6000 250 5000 200 pg/ml 4000 150 3000 100 2000 50 1000 0 0 Control Oral Nasal Control Oral Nasal TGF-b IL-10 700 2500 600 2000 500 pg/ml 1500 400 300 1000 200 500 100 0 0 Control Oral Nasal Control Oral Nasal Cytokine production
Tolerance & antigen presentation in the mucosa Peripheral tolerance is associated with generation of regulatory T cells (Th3, Tr1, CD4+CD25+,LAP+) that produce anti-inflammatory cytokines. Type of antigen presentation that favor the development of regulatory activity in the gut mucosa is still unknown Nasal tolerance - IL-10-producing T cells (células Tr1) (Akbari et al, 2001) Oral tolerance – T cells that produce IL-10 and TGF-b (células Th3 cells) (Weiner, 1998) Differentiation of IL-10-producing cells occurs after interaction with mature DCs that express co-estimulatory molecules (CD80,CD86) and produce IL-10 (Akbari & Umetsu, 2002) Mucosal milieu (APCs) is critical for the generation of this regulatory acitivity (Weiner, 2001) DCs are important for oral tolerance induction (Viney et al, 1998; Alpan et al, 2001)
Sites of oral tolerance induction M cells Spleen LP PP Liver ? Toracic duct MLN Systemic circulation Lymphatic vessels
surgery 30 days OVA Salina 7 days OVA + CFA OVA + Al(OH)3 7 days 14 days 14 days Proliferation Cytokines Oral tolerance in MLN-deficient mice Experimental Control DTH Antibody production
Oral tolerance in MLN-deficient mice OVA + CFA –Th1 response MLN+ MLN- MLN+ MLN- 3,5 120000 3 100000 2,5 * 80000 2 1mg x5 O.D. 492 nm Delta CPM * 60000 1,5 40000 1 20000 0,5 0 0 3 60000 2,5 50000 * 2 40000 20mg x5 Delta CPM O.D. 492 nm 1,5 30000 ** 1 20000 0,5 10000 0 0 Tratamento oral Saline OVA Saline OVA Saline OVA Saline OVA Proliferation Serum IgG
Oral tolerance in MLN-deficient mice OVA + Al(OH)3 – Th2 response MLN+ MLN- MLN+ MLN- 3,5 40000 3 20000 2,5 * 2 1mg x5 O.D. 492 nm Delta CPM 30000 1,5 1 10000 0,5 0 0 3 30000 2,5 25000 2 20000 * 20mg x5 Delta CPM O.D. 492 nm 1,5 15000 1 10000 0,5 5000 0 0 Tratamento oral Saline OVA Saline OVA Saline OVA Saline OVA Serum IgG1 Proliferation
Oral tolerance and cytokine production OVA + CFA - Th1 response IL-2 IL-4 MLN+ MLN- MLN+ MLN- 6000 200 5000 150 4000 1mg x5 pg/ml 3000 100 2000 50 1000 0 0 IFN-g IL-10 4000 6000 3500 3000 5000 2500 4000 1mg x5 pg/ml 2000 3000 1500 2000 1000 1000 500 0 0 Tratamento oral Saline OVA Saline OVA Saline OVA Saline OVA
TGF-b production in MLN-deficient mice MLN+ MLN- 300 250 1mg x5 pg/ml 200 100 0 Feeding Saline OVA Saline OVA
Role of antigen presentation in MLN: . Oral tolerance induction in MLN-deficient mice resemble nasal tolerance. . MLN seem to be important for IgG1 suppression/TGF-b production after feeding. .Future experiments: . Transfer MLN cells to MLN-deficient mice to study the role of different subsets: - - T cells - DCs . Study MLN ablation in IL-10ko mice . Transfer spleen and PP cells from tolerant mice Study antigen presentation and the generation of LAP+ cells in MLN
Células T LAP+ LAP (latency associated peptide) is a peptide that forms the precursor of TGF-b. Its cleavage by enzymes such as trombospondin-1 occurs outside the cell and gives origin to the active form of the cytokine (Miyazono, 1993) The membrane form of TGF-b (LAP) can bind to the TGF-b receptor and exert its function (Nakamura et al, 2001) LAP+ T cells usually express trombospondin-1 (Oida et al, 2003) CD4+CD25-LAP+ T cells have immuno-regulatory activity and suppress inflammation in the gut mucosa (Oida et al, 2003).
CD4+CD45RBhigh CD4+CD45RBlow CD4+CD25- T cell that express latency-associated peptide on the surface suppress CD4+CD45RBhigh induced colitis by a TGF-b-dependent mechanism. Takatoku Oida, Xingmin Zhang, Masao Goto, Satoshi Hachimura, Mamoru Totsuka, Shuichi Kaminogawa & Howard Weiner. J.Immunol. (2003) 170: 2516 BALB/c SCID LAP+ cells Colitis suppression 60 days Body weight Powrie et al 1995
250000 PP PP MLN 200000 SP MLN C.P.M. 150000 Spleen Spleen 100000 50000 0 T cells APCs (non-T) Proliferation Kinetics of antigen presentation in the gut 100mg OVA DO.11.10 BALB/c Proliferation Beads anti-Thy1 1 3 6 12 Hours post-feeding
MLN - 6h Pictures
6h Control 3h 21% 22% 24% 21% 70% 74% 60% 20% 99% APC CD4+LAP+ T cells in vitro SP PP MLN
CD4+ LAP+ OVA Oral 25 mg x5 CD3+ cells SP MLN PP CLN Nasal 2.5 mg x3 Generation of LAP+ cells in vivo 22% DO.11 mice – TCR transgenic 24 hours 60%
Frequency of CD4+LAP+ e CD4+CD25+ T cells after oral e nasal treatment CD4+LAP+ T cells CD4+CD25+ T cells 30 30 25 25 20 20 % positive cells 15 15 10 10 5 5 0 0 SP MLN PP CV SP MLN PP CV Control OVA oral OVA nasal
Treatment with Flt3L by mucosal route Controle FLT i.p. FLT oral FLT nasal Spleen MLN
Efeito do tratamento com Flt3L nas APCs CD11c+ cells CD11c+CD11b+ cells 20 45 16 35 12 25 % positive cells 8 15 4 Control 5 0 0 FLT i.p. SP MLN PP CV SP MLN PP CV FLT oral CD11c+CD8a+ cells CD11b+CD11c- cells FLT nasal 60 25 50 20 40 15 % positive cells 30 10 20 5 10 0 0 SP MLN PP CV SP MLN PP CV
Effect of Flt3L treatment by oral e nasal route CD4+LAP+ T cells CD4+CD25+ T cells 30 40 35 25 30 20 25 % positive cells 15 20 15 10 10 5 5 0 0 SP MLN PP CV SP MLN PP CV Control DO.11 mice FLT3L - oral 25mg OVA x5 – FLT3L – 1 day later - sacrifice nasal 2.5mg OVA x3 OVA oral OVA nasal OVA+FLT oral OVA+FLT nasal
TGF-b production is important for the inhibition of IgG1 that is observed only after feeding • MLN are priviledged sites for the generation of TGF-b producing-cells (Th3 e LAP+) • MLN APCs favour differentiation of these T cells What are the features of these APCs?
Resistant (TR) Susceptible (TS) TR and TS mice P/J C57BL/6J DBA/2J SWR/J SJL/J CBA/J BALB/cJ A/J Bidirectional genetic selection Equilibrated interbreeding Ovalbumin (5 mg) 18 generations
Oral tolerance in TR and TS mice OVA + CFA –Th1 response TS mice DTH TR mice 5mg OVA 5mg OVA 20mg OVA 0,02 0,02 0,02 0,016 0,016 0,016 Footpad increment 0,012 0,012 0,012 * 0,008 ** 0,008 * 0,008 * 0,004 0,004 0,004 0 0 0 Serum IgG 5 5 5 4 ** * 4 4 3 O.D. 492nm 3 3 * * 2 2 2 1 1 1 0 0 0 Salina 20mg OVA gavage Salina 5mg OVA gavage Salina 5mg OVA gavage 20mg OVA Cont. feeding 5mg OVA Cont. feeding 5mg OVA Cont. feeding Feeding
APCs subsets in MLN TS mice TR mice 100 2,5 * 80 * 2 * 60 1,5 % psotive cells b % positive cells a 40 1 20 0,5 a b 0 0 RT ST CD11c+ CD11c+ CD11c+ CD11b- CD8a+ CD11c+ CD11c+ CD8a- CD11b+ CD8a+ CD3+CD8+ CD3+CD4+ CD19+
Dendritic cells (CD11c+) in the MLN Co-stimulatory molecules 14 12 * * 10 8 % positive cells 6 4 2 0 CD40 CD86 CD80 TS mice MHC expression TR mice 300 250 * 200 Mean fluoresnce 150 100 50 0 RT ST
APCs in MLN of oral tolerance susceptible mice Higher frequency of CD19+ and CD11c+ cells Higher frequency of certain CD11c+ subsets: CD11c+CD11b-CD8a+ CD11c+B220+ Phenotype of CD11c+ cells; Lower frequency of CD86+ and CD40+ cells Lower expression of MHC
CD45RBlo CD44hi CD62Lloa4b7hi Ag APC APC IL-4, IL-10, TGF- PGE-2 HEV SLC MIP Intestinal milieu tolerance inflammation
Effect of inflammation in the gut millieu gastritis oral tolerance enteritis colitis
Immunological effects of alcohol • supppression of Th1-type cytokine production; • alterations in subsets of lymphocytes in spleen and peripheral blood; • reduction of secretory IgA production in the intestineand in the number of CD4+ T cell in LP; • alterations in proliferation of T cells and in antibody production by B cells; • Effects on the innate immune system: • inhibitionof TNF-a, IL-1 and IL-6 production by peripheral blood monocytes ; • alteration in the expression of cytokine receptors by macrophages; • decrease in the capacity of phagocytosis by Kupffer cells;
Induction of gastritis • Chronic use of non-steroidal anti-inflammatory drugs (aspirin); - Neonatal thymectomy with ablation of CD4+CD25+ T cells • Infeccious agents (Helicobacter pilori); - Mice deficient in the a chain of the IL-2 receptor (CD25+) • Chronic consumption of alcohol
Model of alcohol-induced gastritis ethanol 50% or saline 4 days . . Sacrifice C57BL/6 24 hours gastritis control
Functional alterations in the stomach • gastromegalia; • reduction of proteolytic activity of pepsin; • loss of barrier function; • reduction of mucous producing cells (goblet cells). Systemic alterations • leucopenia ; • reduction of peripheral blood mononuclear cells; • anemia.
stomach duodenum prox jejun distal jejunum ileum Local cytokine production 30 IL-4 20 pg/ml 10 * * ND ND 0 1200 IFN-g control * 1000 gastritis 800 pg/ml 600 400 200 0
Cytokine production by ConA-stimulated spleen cells 0.4 IL-4 0.3 pg/ml 0.2 0.1 ND 0 0.8 IFN-g 0.6 0.4 ng/ml 0.2 0 gastritis control
Cytokine production by ConA-stimulated spleen cells 0.4 IL-10 0.3 ng/ml 0.2 0.1 ND 0 8 IL-2 6 pg/ml 4 2 0 control gastritis