Download
1 / 21
210 likes | 247 Vues
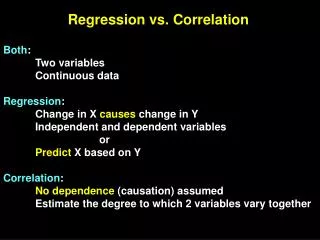
Unit 4: Correlation and Causation. Now, a single datum is two values Are variables related (associated)? – i.e., if one changes, is the other likely to change?. Statistical clich é: Association does not imply causation.

E N D
Now, a single datum is two values • Are variables related (associated)? – i.e., if one changes, is the other likely to change?
Statistical cliché: Association does not imply causation • Ex: Sleeping with one's shoes on is strongly correlated with waking up with a headache. Therefore, sleeping with one's shoes on causes headache. • (Or more likely, a common cause is drunkeness) • Ex: Study at U of PA Med Ctr, 1999: Young children who sleep with the light on are much more likely to develop myopia in later life. • (Later researchers found another common cause: Parents’ myopia.)
From Smithsonian Magazine, Aug ’98: • The Vermont Back Research Institute at the Univ of Vermont uses the “Vermont Disability Prediction Questionnaire” to predict whether a back problem will become disabling. Items include: • How many times have you visited a medical doctor in the past for back problems? • How many times have you been married? • How well do you get along with your coworkers? • Why do they ask these questions? Dr, Roland Hazard shrugs: “We don’t know.” It’s just that answers to such questions have proved predictive on whether back problems will become disabling. • I.e., they are related, but we don’t know how.
Which kinds of variables? • Both categorical: compare percentages • Ex: gender vs. physical activity (S ’06) • Input variable categorical: compare avgs • Ex: digital ratios • Both numerical • scatterplot (“correlation” and “regression”) • Ex: babyboom
Are these associations positive or negative? weak or strong?
Correlation (coefficient) r • Gives a measure of how closely points follow a straight line • Always between -1 and 1 • r = 1: all pts on a line with + slope • r = -1: all pts on a line with – slope • r near 0: blob • [Formula: turn x- and y-values into z-scores, multiply for each point, find avg product] • History: Invented by Karl Pearson (1857-1911)
“SD-line” [FPP only] • Okay, r measures how closely data follows a line. Which line? • through “point of averages” (x , y ) • slope: ±σy / σx ,where • sign is + if r > 0 , - if r < 0 • Ex: Baldness study: # hair (in 10K’s) avg 40, σ = 15; ages avg 36, σ = 20; r = -.3. If hair is on vertical axis, SD-line? • Ex: Scores on first exam avg 75, σ = 15; on final exam avg 110, σ = 35; r = .5. SD-line?
“Covariance formula” for r (FPP p.134) r = ((avg of xy) -xy)) /( σxσy ) Numerator is the “covariance of x and y”
Remarks on r • r is • a pure number (no units) • not affected by • reversing variables • linear changes of variables [changes of units, like ft to m]
r is affected by … • nonlinear association • outliers • combining different groups, with different centers (Simpson’s Paradox II) • “ecological correlations”, i.e., correlations of averaged data points • [examples shortly]
SAT scores Average scores from school districts in Cayuga, Madison, and Oswego counties for the 1998-99 school year Verbal / Math r = 0.770