Download
1 / 25
260 likes | 415 Vues
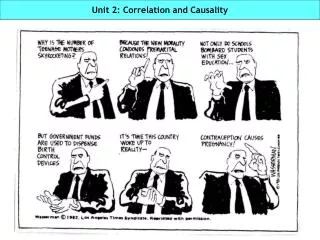
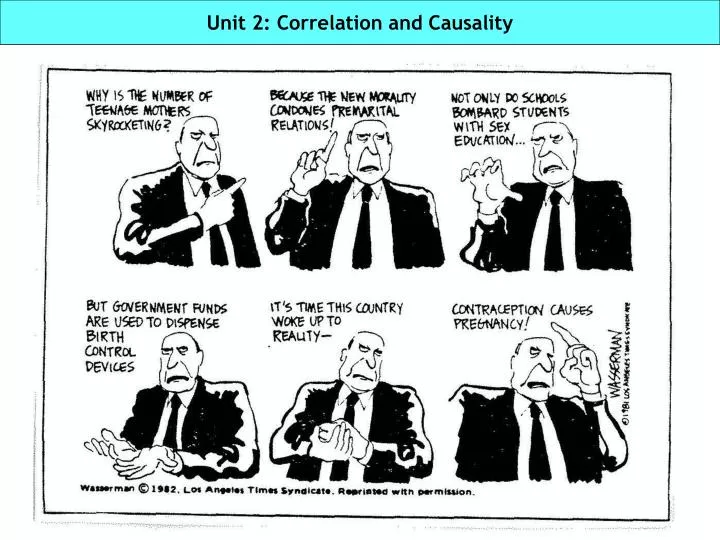
Unit 2: Correlation and Causality. The S-030 roadmap: Where’s this unit in the big picture?. Unit 1: Introduction to simple linear regression. Unit 2: Correlation and causality. Unit 3: Inference for the regression model. Building a solid foundation. Unit 5: Transformations

E N D
The S-030 roadmap: Where’s this unit in the big picture? Unit 1: Introduction to simple linear regression Unit 2: Correlation and causality Unit 3: Inference for the regression model Building a solid foundation Unit 5: Transformations to achieve linearity Unit 4: Regression assumptions: Evaluating their tenability Mastering the subtleties Adding additional predictors Unit 6: The basics of multiple regression Unit 7: Statistical control in depth: Correlation and collinearity Generalizing to other types of predictors and effects Unit 9: Categorical predictors II: Polychotomies Unit 8: Categorical predictors I: Dichotomies Unit 10: Interaction and quadratic effects Pulling it all together Unit 11: Regression modeling in practice
In this unit, we’re going to learn about… • Developing a heuristic understanding of the correlation coefficient (r) • Understanding correlation as regression on standardized variables • The relationship between r and R2—how large is large? • From correlation to causality • Randomized experiments: The “gold standard” for establishing causality • What can you do when randomized experiments aren’t possible? • When might an observed correlation not indicate a causal relationship? • Spurious correlation, confounding, Simpson’s paradox, reciprocal causation and ecological correlation • Conditions for establishing causality
RQ: Is there a link between TV exposure and attention deficit problems? Read the Pediatrics article Listen to the NPR Interview
Developing a measure of “co-relation”: Meet Karl Pearson(27 March 1857 – 27 April 1936) Heredity: relationships between siblings and spouses(Pearson & Lee, 1903, On the laws of inheritance in man, Biometrika) • Pearson, Galton’s advisee and the first Galton Professor of Eugenics at University College, London (shown here with Galton at right) • Fun fact: Born Carl (with a C) changed his name to Karl (with a K) after Karl Marx • Developed, or named, many of the basic tools of modern statistics, including standard deviation, 2 goodness of fit, and correlation • Pearson’s “problems” to solve: • Neither variable is an “outcome” or a “predictor” • The measure of correlation should be dimensionless, (eg., applicable for inches or feet, digit span or stature) • His solution: Re-express (transform) both variables on new “standard” scales that essentially eliminate the particular metrics of the original scales Learn more about Karl Pearson
Transformation and standardization: Re-expressing a variable’s scale Standardization: A particular transformation that yields a new variable with mean = 0 and sd = 1 Mean = 98.11 sd = 15.21 Mean + 2sd Mean + 1sd Mean Mean - 1sd ID OwnIQ SOwnIQ FostIQ SFostIQ 1 68 -1.9985 63 -2.3080 2 71 -1.7943 76 -1.4535 . . . 25 95 -0.1606 96 -0.1389 26 96 -0.0925 93 -0.3361 . . . 52 129 2.1539 117 1.2415 53 131 2.2900 132 2.2274 Mean - 2sd Mean - 2sd Mean - 1sd Mean + 1sd Mean + 2sd Mean Mean = 97.36 sd = 14.69 • Standardization... • Forces the sample mean of the new variable to be 0 and its sd to be 1 • The new values measure an individual’s distance from the sample mean in sd units • Doesn’t change anyone’s relative rank • Doesn’t create a normally distributed variable Transformation: Any re-expression of a variable’s scale
Using a regression on standardized variables to understand correlation Slope of the standardized regression line assesses the estimated difference in FostIQ (measured in standard deviation units) per standard deviation in OwnIQ Standardized regression line goes precisely through (0,0) At average X (SOwnIQ=0), we predict average Y (SFostIQ=0) ^ Pearson product-moment coefficient, r Does 0.8767 seem familiar?
Plots to help develop your intuition for interpreting r Cool interactive applet for learning more about correlation
Understanding the relationship between r and R2(and their use as measures of “effect size”) r R2 1-R2 .1 1% 99% Not uncommon in social sciences, but when r < .2, you have very little explanatory power (R2 < 4%) .2 4% 96% .3 9% 91% Covers most “statistically significant” correlations in social sciences, but even when r = .5, you’re only explaining 25% of the variance in Y .4 16% 84% .5 25% 75% Rare in the social sciences and even when r = .7, you’re still explaining less than ½ the variance in Y .6 36% 64% .7 49% 51% .8 64% 36% Extremely rare in the social sciences, unless you have aggregate data or a coding problem(!) .9 81% 19% .95 90% 10% Cohen’s guidelines Small: r=.10 Medium: r=.30 Large: r=.50 Another way of thinking about r is as a measure of effect size
From correlation to causality Identified mechanism You have a sound theory to explain how a change in the predictor produces a change in the outcome Consistency You find the same result in other populations, with different characteristics, at different times What do we really mean when we say: “Associated with” “Related to” “Explained by” “Varies with” “Covaries with” “I interpreted…Galton…to mean that there was a category broader than causation, namely correlation…and that this new conception of correlation brought psychology, anthropology, medicine, and sociology in large parts into the field of mathematical treatment. It was Galton who first freed me from the prejudice that sound mathematics could only be applied to natural phenomenon under the category of causation. Here for the first time was a possibility, I will not say a certainty, of reaching knowledge—as valid as physical knowledge was then thought to be—in the field of living forms and above all in the field of human conduct.” Karl Pearson, 1889 Four criteria for establishing causality Responsiveness You demonstrate that a change in the predictor actually produces a change in the outcome No plausible alternative explanation There’s no rival predictor that can explain away the observed correlation Highest priorities for design and analysis and often the hardest to establish Counterfactual reasoning provides a powerful lens for thinking about these questions You’d like to know what outcome values these individuals would have had if they had received a “different treatment” (ie, if they had different predictor values)?
Why randomized experiments are the “gold standard” Narrative development in bilingual kindergarteners: Can Arthur help?Yuuko Uchikoshi (2005) Developmental Psychology RQ:Can narrative skills be ‘taught’ via TV to English Language Learners? Arthur BTL October (pretest) 5.00 (3.50) 4.82 (4.02) February (midterm) 7.04 (3.56) 5.69 (3.87) (n=57) May/June (posttest) 9.13 (4.35) 7.16 (3.75) (n=51) Four important attributes of randomized experiments The researcher actively intervened in the system, actually changing X (the treatment) and seeing what happens to Y Because of random assignment, groups are guaranteed to be initially equivalent, on average, on all observable (and unobservable) characteristics The control group provides the ideal counterfactual—our best estimate of what the treatment group would have looked like if it didn’t receive the treatment Any difference found in Y must be due to the changing of X (the treatment) because there’s no other plausible explanation
There will always be studies where researchers have the burden of proof “You can’t fix by analysis what you bungled by design…” Light, Singer and Willett (1990) • How might you try to establish responsiveness? The key question is: • How are predictor values assigned? • They’re not: they’re immutable characteristics of people • Participants choose them • Researchers assign them (but not randomly) • Outside forces inadvertently change them • External raters assign them using a ranking criterion (e.g., identifying those above a cut-score) Ethics: Morally, there are some treatments to which you can’t expose people Does radiation cause cancer? Many would argue that these can’t be “causes” When participants (or even researchers) choose, the conclusions are weaker because they’re subject to selection bias Feasibility: Logistically, there are some treatments to which you can’t assign people Does education cause increased income? Natural experiments Regression discontinuity designs Time: Practically, some information is better than no information Does quality child care cause better life outcomes? • How might you eliminate alternative explanations? The key question is: • Can the findings be explained away? • Can you establish that the groups were equivalent initially? • Can you isolate that portion of the variation in X that’s exogenous (not subject to selection bias) ? • Can you rule out other explanations for the observed association? Matching (especially propensity score matching is very popular now) Instrumental variables Availability of data: With so much data, shouldn’t we analyze it? Let’s think about how you might go about doing this
Non-experimental data: Might the correlation be causal? Causation Correlation X Y X X Y Y US Committee on Gov’t Reform “When forced to take legally binding positions, the tobacco industry still does not accept scientific consensus … that…cigarettes cause disease in smokers [and] that environmental tobacco smoke causes disease in nonsmokers. Read the Waxman (2002) report Tobacco industry statements in the Department of Justice Lawsuit ? Does Imply But, just because we haven’t done an experiment doesn’t mean the correlation isn’t causal Sample Tobacco Industry Statements • “[the causes of diseases] are complex, and the mechanism of causation, as well as the possible role of any cigarette smoke constituent in causation, have not been scientifically established” • [At] least two standards for establishing causation exist. An epidemiological standard of causation, based primarily on statistical evidence, … [and] the more rigorous traditional scientific standard…[which] requires, among other things… well-designed and conducted … experiments.”
Even experiments aren’t foolproof: The MRFIT trial 17 September 1982 Heart Attack Study Finds Men Heeding Health Advice BetterA federally financed study of 12,866 men -- half exhorted to improve their health habits and half getting only "usual care" from their doctors--has produced an unexpected result: Both groups had the same rate of heart attacks, but it was only one-fourth the rate of the general population of the same age.What happened [is that] almost all Americans were reading and hearing advice to smoke less, eat fewer fats and lower their cholesterol level and blood pressure. Exhorted or not, most of the men in the study and their doctors apparently got the same message, and did even better than the average American. Find Article on LexisNexis
Spurious Correlation: Common Response to a Third Variable X Y Z Soft Drink Consumption Polio Incidence But not all spurious correlations are nonsense Pigou (1899) SES is often the “3rd variable” It is easy to prove that the wearing of tall hats and the carrying of umbrellas enlarges the chest, prolongs life, and confers comparative immunity from disease… A university degree, a daily bath, the owning of thirty pairs of trousers, a knowledge of Wagner’s music, a pew in church, anything, in short, that implies more means and better nurture…can be statistically palmed off as a magic spell conferring all sorts of privileges…The mathematician whose correlations would fill a Newton with admiration, may, in collecting and accepting data and drawing conclusions from them, fall into quite crude errors by just such popular oversights --George Bernard Shaw (1906) ? There’s a 3rd variable, Z, which causes changes in X and may—or may not—also cause change in Y Yule (1899) An investigation into the causes of changes in pauperism in England Poorhouses Pauperism Yule’s footnote 25 “Strictly speaking, for ‘due to’ read ‘associated with.’ ”
Confounding: A “confusion of effects”:A third variable may (or may not) explain away (or reduce) the correlation 25 Feb 1993 Crack cocaine study faulted on race factorA study carried out four years ago has created the false perception that crack cocaine smoking is more common among blacks and Hispanics than among white Americans, say scientists who reanalyzed the findings in a new report. The 1988 National Household Survey on Drug Abuse said that rates of crack use among blacks and Hispanics were twice as high as among whites. But the study failed to take into account social factors such as where the users lived and how easily the drug could be obtained, according to researchers writing in yesterday's issue of the Journal of the American Medical Association. The authors, from Johns Hopkins University, said that when adjusted for those factors, the study found equivalent use of crack among blacks, Hispanics and whites. "Researchers have the responsibility to go beyond the reporting of racial and ethnic differences" because such findings "are often presented as if a person's race has intrinsic explanatory power," the authors wrote. X Y Race Cocaine There’s a 3rd variable, Z, which is correlated with X and which causes changes in Y, but we don’t know if this explains away the correlation between X & Y ? Z Find Article on LexisNexis
Simpson’s paradox: A third variable may reverse(!) the correlation - + X Y Z Male Admission - + Some confounders don’t just ‘explain away’ the association, they reveal a reversal in the direction of the effect r = -0.56 Sex bias in graduate admissions: UC Berkeley (1973) Learn more about Simpson’s paradox
Reciprocal causation: Do happy mothers make happy babies? Or it is the other way around? X Y ? ? X may cause Y or Y may cause X—with the data we have, we just can’t tell • Cross-sectional observational studies are particularly susceptible to questions of reciprocal causation • Special education placements and reading scores:the more segregated the placement, the lower reading scores • Motherhood and suicide risk: married women with children are at lower risk of suicide than unmarried women; the more children the lower the risk • Depression and smoking: teens who are daily smokers are more likely to be seriously depressed
Ecological correlation: Aggregate and individual correlations may differ Robinson, W.S. (1950). Ecological Correlations and the Behavior of Individuals. American Sociological Review 15: 351–357. individual ? (Rural, low foreign born, but lots of illiterates) Correlations with Illiteracy Unit of analysis Black Foreign Born 97,272 individuals .203 .118 48 states .773 -.526 9 regions .946 -.619 (Urban, lots of foreign born, but also lots of very literate folks) Aggregate data describe aggregate relationships, not individual level relationships Y aggregate X aggregate
Where to go to learn more about establishing causality In recent years, there has been an explosion of interest in the conditions necessary for establishing causal inferences. Different disciplines use different standards and approaches, and there is much to learn by reading broadly. Here are some sources that I find particularly interesting and insightful: • Discussions focused on education • Shavelson, RJ & Towne, L eds (2002) Scientific Research in Education. Washington, DC: National Academy Press. • Angrist, JD (2004). American education research changes tack. Oxford Review of Economic Policy, 20(2), 198-212 • Gamse, BC & Singer, JD (2005) Lessons from the Red Sox Playbook. Harvard Education Letter, 21(2), 7-8 • Cook, TD (2001) Sciencephobia: Why education researchers reject randomized experiments. Education Next, Fall, 63-68 • Discussions focused on psychology • Rutter M (2007) Proceeding from Observed Correlation to Causal Inference: The Use of Natural Experiments, Perspectives on Psychological Science, 2(4) 377-395. • Discussions focused on epidemiology • Rothman, KJ & Greenland, S (2005). Causation and causal inference in epidemiology, American Journal of Public Health, Supplement 1, 95(1), S144-S150 • Maldonado, G & Greenland, S (2002). Estimating causal effects. International Journal of Epidemiology, 31, 422-429. • Krieger, N (1994). Epidemiology and the web of causation: Has anyone seen the spider? Social Science and Medicine.39(7) 887-903. • General overviews • (warning: some of these are very technical) • Shadish, WR, Cook, TF and Campbell, ST (2002). Experimental and Quasi-Experimental Designs for Generalized Causal Inference, Boston, MA: Houghton Mifflin. • Holland PW (1986) Statistics and causal inference (with discussion). Journal of the American Statistical Association, 81, 945-970. [Link to search results for article and discussion.] • Freedman, DA (2004). Graphical models for causation and the identification problem. Evaluation Review, 28(4), 267-293. • Rubin, DB (2005) Causal inference using potential outcomes: Design, Modeling, Decisions. Journal of the American Statistical Association, 100, 322-331. • Discussions focused on sociology • Winship, C & Morgan, S (1999). The estimation of causal effects from observational data. Annual Review of Sociology, 25, 659-707. • Morgan, SL & Winship, C (2007). Counterfactuals and Causal Inference: Methods and Principles for Social Research. NY: Cambridge U Press.
What’s the big takeaway from this unit? • Correlation coefficients are nifty tools when used correctly • Having a scale free measure of association is a powerful concept; you can develop your intuition about the meaning of correlations and that intuition will carry across all types of variables • The size of a correlation tells you about the strength of a relationship, not its magnitude. For the magnitude, you need the slope • Correlation Causality • Randomized experiments are the gold standard for establishing causality, but even with them there can be limits to your inferences • There are many reasons why you might find a correlation between an outcome and a predictor; learn how to think about alternative explanations and evaluate whether they’re likely to hold in any given context • When analyzing data, consider the steps involved in going from correlation to causality and decide how far your inferences can go • There are many other issues involved in moving from correlation to causality • But before being able to tackle these more technical treatments, you need to know much more about the basic regression approach • We offer entire classes, A-164: Program evaluation and S-290: Quantitative methods for improving causal inference
Appendix 1: Annotated PC SAS code for Unit 2, Burt data Don’t forget the semicolonat the end of every statement; options nodate nocenter nonumber; title1 "Unit 2: IQs of Cyril Burt's identical twins"; footnote1 "Program: Unit 2--Burt analysis.sas"; *-----------------------------------------------------* Be sure to update the infile reference to the file's location on your computer *-----------------------------------------------------*; *---------------------------------------------------- * Input Burt data and name variables in dataset *-----------------------------------------------------*; data one; infile 'm:\datasets\Burt.txt'; input ID 1-2 OwnIQ 4-6 FostIQ 8-10; *-----------------------------------------------------* Estimate bivariate correlation between owniq & fostiq (Pearson correlation coefficient) *-----------------------------------------------------*; proc corr data=one; var owniq fostiq; run; quit; Don’t forget to specify the location of the raw data, and check that you are indicating the appropriate drive proc correstimates bivariate correlations between variables you specify. Its var statement syntax is var1 var2 var3 … varn(note that it has neither an * (like proc gplot) or an = (like proc reg)
Appendix 2: My $0.02 on the need for randomized trials in education
Glossary terms included in Unit 2 • Aggregate data • Causality • Confounder • Correlation • Reciprocal causation • Spurious • Standardization • Transformation