Download
1 / 29
290 likes | 297 Vues
Learn how to troubleshoot and optimize the performance of a SQL Server Enterprise Geodatabase, including general configuration recommendations, recovery models, trace flags, and maximum degree of parallelism.

E N D
Troubleshooting SQL Server Enterprise Geodatabase Performance Issues Matthew Ziebarth and Ben Lin
Troubleshooting SQL Server Enterprise Geodatabase Performance Issues AGENDA • General configuration recommendations • Recovery models & log space • Trace flag 4199 • Max Degree of Parallelism • Demo on MAXDOP • Final Notes • Q & A
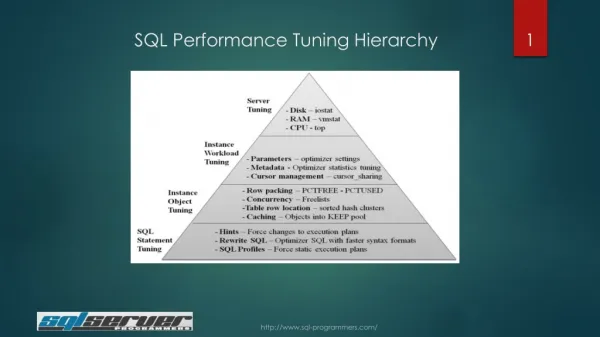
The ArcSDE DBTUNE Table • Use the DBTUNE table to separate data types • This is not just for performance, but also for data recovery • A RAID will not eliminate all disk contention and I/O • Flash storage will not compensate for data file contention SQL Server DBTUNE configuration parameters https://desktop.arcgis.com/en/desktop/latest/manage-data/gdbs-in-sql-server/configuration-parameters-sqlserver.htm
Types of data to separate • In DBTUNE: • Business tables from delta tables • Business indexes from delta indexes • Complex dataset types such as networks, topologies • On DISK: • Data files from log files IX B
The log may be slowing you down • LDF files become very large • Writing to any log file takes time
Recovery Models • Simple Model. No log backups. Work-loss exposure = last full database backup. This may be suitable for your organization. • Full Model. Large log backups including all transactions. Near-zero work-loss exposure. These logs must be stored on server as well as backed up to ensure full historical point in time recovery. Data file corruption, no problem. • Bulk Model. Reduced size of Full but still large log files. Work-loss exposure = last log backup. No point in time recovery. +
Trace flag 4199 “The Principle of Least Surprises”
Trace Flag 4199 • Trace flag 4199, per Microsoft: “Controls multiple query optimizer changes previously made under multiple trace flags. “ And… “...any hotfix that could potentially affect the execution plan of a query must be controlled by a trace flag. Except for fixes to bugs that can cause incorrect results or corruption, these hotfixes are turned off by default, and a trace flag is required to enable the fix.” • Enable this globally to take advantage of bug fixes.
What comprises Degree of Parallelism? • The DOP is based on multiple factors of the OS and the Database Instance: • # of available CPU Cores • # of available logical threads • Type of query • # of rows returned • Availability of distribution statistics • Hardware + Utilization + Query + Output + Stats = DOP
What is a CPU Core Count? • The physical number of cores on the CPU within the processor packages • To find this: Click on Run and type MSINFO32
What is the Thread Count? If the CPU uses multi-threading, the logical thread count is the core count x2. 2 x
What Type of Query? • The query operators, or query steps, need to be expensive to take advantage of parallelism. Otherwise the query will execute serially. • Mathematically, parallelism is used when the estimated cost of the operation is higher than the cost threshold for parallelism setting.
What are Distribution Stats? • Refers to high or low (poor) selectivity • Unique key has high selectivity; there is 1 • Ben will demonstrate this in the DEMO The actual selectivity is not as important for DOP as maintaining these statistics.
The Cost Threshold for Parallelism • If the SQL Server query optimizer believes a query operator will take this amount of cost units (in seconds) if run serially, this parameter is reached. • The default is 5 and can be set between 0 and 32767 seconds, or about 9 hours. • Threshold is reached, therefore parallelism! • This is a very old default value but your data design factors into changing it. The coordination of the parallel threads also has a hidden cost!
Why is this happening? • It’s a complex bug in that the inverse of what you would expect to occur, occurs. • Query Optimizer incorrectly computes it would be fastest to coordinate all available threads to return your spatial results. The Spatial Index is not used… • This is intermittent because if utilization is high and spare cores do not exist to use within a query, parallelism isn’t an option sometimes. !
How do we diagnose? • This will come in to your GIS/T department as a performance problem that will be intermittent and inverse to server load. • Get the full configuration of the SQL Server database (exact build) and the database server hardware such as CPUs, Cores, Processors, Model/Brand, and RAM. • Ask about utilization trends. • SQL trace or Execution plan check for spatial index. *This issue only applies to SQL Server Geometry or Geography types.
How do we fix this? • The fastest way to diagnose and “fix” this is to alter the MAXDOP setting. (In a Test environment first, preferably) • 1 = DISABLE parallelism. 2 = 2 cores per operator, and so on. • Generally users should find a “sweet spot” MAXDOP setting or adjust per data. THIS SETTING DOES NOT REQUIRE A RESTART OF ANY KIND. IT IS DYNAMIC. • When you can, patch this. Please see KB articles on final page. *The default was finally changed from 0 to a hardware calculation in SS 2016!
MAXDOP Demo Ben Lin
Final Notes • Check your MAXDOP settings! • Make sure your feature classes have a spatial index • Use Compress, Analyze Datasets, Rebuild Indexes often • Use SQL Server Profiler • Examine execution plans • Enable SDE Intercept • Contact Esri Technical Support for assistance
Thank you… • Please fill out the session survey in your mobile app • Select “Troubleshooting SQL Server Enterprise Geodatabase Performance Issues” in the Mobile App • Use the Search Feature to quickly find this title • Click “Demo Theater Survey” • Answer a few short questions and enter any comments
Want to learn more? • Esri Documentation • ArcGIS 10.3 SQL Server DBTUNE configuration parameters • Esri KB 35704 - SDE Intercept • Esri KB 38871 - SQL Server MAXDOP • Esri KB 36617 - SQL Server Spatial Index Hinting • Microsoft Documentation • MS KB 2570501 - MAXDOP Bug Fix for 2008 • MS KB 2757097 - MAXDOP bug in 2012 - Defect 630366 • Defect 20179508 - Spatial index not used on multiproc machine unless MAXDOP set downward • MS Premier Field Engineer MAXDOP tips • SQL Server Recovery Models • Trace flag 4199 • Give us a call at ESRI Technical Support at 888-377-4575