Download
1 / 32
340 likes | 743 Vues
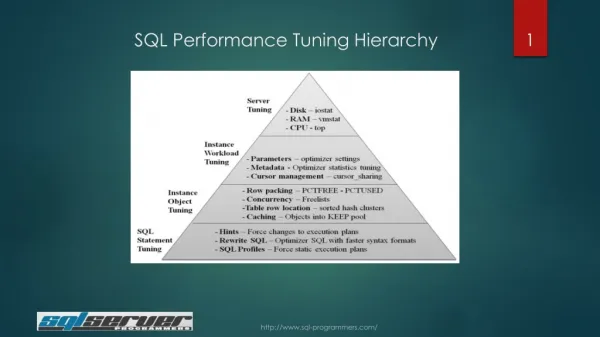
6. Monitoring SQL Server Performance . Objectives Monitoring Resource Usage Contents Developing a Performance Monitoring Methodology Choosing Among Monitoring Tools Performing Monitoring Tasks Practicals Monitor your SQL server system Summary.

E N D
6. Monitoring SQL Server Performance • Objectives • Monitoring Resource Usage • Contents • Developing a Performance Monitoring Methodology • Choosing Among Monitoring Tools • Performing Monitoring Tasks • Practicals • Monitor your SQL server system • Summary
Developing a Performance Monitoring Methodology • Establish appropriate and effective monitoring goals • Determine which activities and resources to monitor • Develop a long-term monitoring strategy • Establishing Monitoring Goals • Before you begin monitoring SQL Server 2000 performance, you should determine your monitoring goals • User perspective • To minimize the response time for each query submitted by each user • Server perspective • To maximize the total server throughput of queries submitted by users
Identifying Performance Bottlenecks • Inadequate hardware resources, such as memory or processor, are common causes of bottlenecks. • Low gauge meter numbers can mean that the system is performing better than expected, but they can also reveal a performance bottleneck. Usally beyond the server hardware. Can be network or software bottlenecks. • Some bottlenecks can be solved by adding additional hardware resources or by moving some of the load to other servers. • Solving one performance bottleneck can reveal another performance bottleneck. • You might need to optimize queries that were efficient with fewer users and plenty of hardware capacity as database utilization changes
Determine Trends • When monitoring SQL Server 2000, you must gain an understanding of the normal range of values for various counters. • You should establish an evolving performance baseline. • This involves recording an initial performance baseline using a number of different monitoring tools. • This will help you understand how various aspects of your system perform under normal production loads
Determining Resources and Activities to Monitor • Hardware resources might be inadequate for the load on the server • Competing server applications on the SQL Server 2000 computer might be using excessive resources • Hardware resource use might be unbalanced • A hardware resource might be malfunctioning • General network congestion might occur • Improper use of cursors or ad hoc queries • Poor database design • Poorly written applications
Choosing Among Monitoring Tools • Using System Monitor • Windows 2000 System Monitor is used to monitor resource usage on either the local computer or a remote computer • Using Task Manager • Task Manager is used to provide a snapshot in real time • Using SQL Profiler • SQL Profiler is a graphical SQL Server 2000 tool used to monitor (trace) selected SQL Server events • Using the SQL Server Enterprise Manager Current Activity Window • The SQL Server Enterprise Manager Current Activity window displays a snapshot of information regarding processes, user activity, locks held by processes, and locks held on objects • Using SQL Query Analyzer • The system stored procedures you can use to monitor SQL Server 2000 activity and performance • Using SNMP • SNMP can only monitor the default instance. • SQL Server 2000 support for SNMP is enabled automatically
Performance Objects for Tracking Using System Monitor • SQL Server: Access Methods • Index and query efficiency based on types of pages accessed • SQL Server: Backup Device • Throughput or progress of backup and restore • SQL Server: Buffer Manager • Lack of physical memory • SQL Server: Cache Manager • Efficiency of plan caching and reuse • SQL Server: Databases • Level of user activity in a database • SQL Server: General Statistics • Overall connection activity • SQL Server: Latches • Performance length of waits for internal resource • SQL Server: Locks • Overall number and types of locks • SQL Server: Memory Manager • Overall memory usage • SQL Server: SQL Statistics • Query compilation speed • SQL Server: User Settable Object
Event Categories That Can Be Monitored Using SQL Profiler • Cursors • The actual types of cursors being used • Database • Automatic growth of data and transaction log files • Errors and Warnings • Locks • Objects • creation of objects by applications and users • Performance • Query execution and query optimizer efficiency • Scans • Types of scans being performed on an object. (tables/indexes) • Security audit • Server • Changes in SQL Server memory usage • Sessions • Connected users, database activity • Stored procedures • to determine additional memory needs • Transactions • TSQL
Using SQL Query analyzer • Sp_who • Active users and their processes • Sp_who2 • Active users and their processes, more readable. • Sp_lock • Blocking locks and deadlocks, and the process causing them. • sp_spaceused • Database or object space usage. • Sp_monitor • Volume of work performed during period of time.
Task Manager • Monitoring Resource momentary Usage • View these columns
Task Manager • Monitoring Resource momentary Usage System to left has enough memory, system to right need more physical memory
System Monitor, analysis Object Counter Recomended value Measures Processor %cpu time <70% Time spent working Memory Pages/sec <5 Ram to disk and reverse Memory Available >4MBhyte Non allocated memory. Memory Commited < physical ram Amount of ram commited Physical Disk Disk queue <2 Waiting to be written Disk % Disk time <50% Disk busy Network Segment Network use <30% Network bandwith used
Monitoring with Windows System Monitor • Log in to Windows as Administrator. • From the Start menu, select Programs -> Administrative Tools -> Performance. • Click the + icon on the toolbar to start adding counters to the chart.
Monitoring, adding some counters 4. In the Performance Object drop-down list, select Processor (not Process). 5. In the counter list box, select % Processor Time and click Add. 6. In the Performance Object drop-down list, select Memory. 7. In the Counter list box, select Pages/Sec and click Add. 8. Click Close and notice the graph being created on the screen.
Monitoring, highligting & alerts 9. Press Ctrl+H and notice the current counter turn white. This makes the chart easier to read. 10. In the left pane, under Performance Logs and Alerts, select Alerts. 11. From the Action menu, select New Alert Settings. 12. Enter Test Alert in the Name box and click OK.
Monitoring, making alert on processor 13. In the Comment box on the General tab of the Test Alert property sheet, type Processor Alert. 14. Click Add, select Processor in the Performance Object drop-down list and % Processor Time in the Counter list box, click Add, then click Close. 15. Back in the Test Alert property sheet select Alert When the Value Is Under and set the value to 100. This will generate an alert if the processor is not busy 100 percent of the time. In the real world, this would be set to Over 70 percent, thus warning you just before it becomes a serious problem.
Monitoring, making alert on processor 16. On the Action tab, check the Send a Network Message To box and enter your machine name in the text box below. 17. Click OK to start the alert and watch the alerts generated for a short time. Then right-click the alert and select Stop to stop the alert from firing. 18. Exit Windows System Monitor. From now on, alerts would be sent to server and logs would be written. This when processor time is under 70 %, this is just testing, in real life OVER would make sense
Logging with Windows System Monitor • Open Windows System Monitor from the Administrative Tools folder on the Start menu. • In the left pane, select Counter Logs. • From the Action menu, select New Log Settings and when the New Log Settings dialog box appears, name the new log Test Log, then click OK. • On the General tab of the Test Log property sheet, under the Counters box, click Add. • In the Performance Object drop-down list, select Processor (not Process). • In the Counter list box, select % Processor Time and click Add. • In the Performance Object drop-down list, select Memory. • In the Counter list box, select Pages/Sec and click Add.
Logging with Windows System Monitor 9. Click Close to return to the Test Log dialog box. 10. On the Log Files tab, notice the location and name of the files that will be created and click OK to start the log 11. Allow the log to run for about five minutes to gather some data. 12. Right-click the Test Log and select Stop to stop the log so that you can read from it. 13.In the left pane, click System Monitor. 14. Now right-click in the gray area of the chart and select Properties. 15. On the Source tab, click Log File.
Logging with Windows System Monitor 16. Click Browse, select the log file created in step 10, and click OK. 17. Click the + icon on the toolbar to add objects to the graph. 18. In the Add Counters dialog box, in the Performance Object drop-down list, select Processor (not Process). 19. In the Counter list box, select % Processor Time and click Add. 20. In the Performance Object drop-down list, select Memory. 21. In the Counter list box, select Pages/Sec and click Add. 22. Click close and notice that the recorded data now appears in the graph. 23. Close Windows System monitor
Monitoring Current Locking and User Activity • Process information, right click on process and select properties. • Locks and Processes ID
Monitoring Current Locking and User Activity • Process information, • Locks and Processes ID • right click on process and select properties. You can see latest SQL message caused process
Using Query Analyzer, check your expressions 1. From the Start menu, choose Programs -> Microsoft SQL Server -> Query Analyzer. 2. When asked to log in, use Windows Authentication. You will see the query window. 3. From the Query menu, select Current Connection Properties. 4. In the property sheet, check Set Statistics Time and Set Statistics IO. Set Statistics Time displays CPU time used, while Set Statistics IO displays disk time.
Using Query Analyzer, check your expressions 5. From the Query menu, select Show Execution Plan to see a graphic representation of how SQL Server executes your query. 6. On the query window toolbar, select Northwind in the DB list box to set Northwind as the default database. 7. In the query window, type the following query: 8. USE Northwind SELECT * FROM employees 9. Click the Messages tab (at the bottom of the screen) and notice the execution, parse, and compile times; then click the Execution Plan tab. 10. In the Execution Plan pane, hold your mouse pointer over each icon in turn; notice that they come with ToolTips to help you better understand each step of execution.
Monitoring with SQL Profiler 1. From the Start menu, choose Programs -> SQL Server -> Profiler. 2. From the File menu, choose New, and then click Trace to bring up the Trace property sheet. You will be asked to log in at this point; do so with either form of authentication. 3. In the Trace Name box, type Monitor. 4. There are several templates to choose from in the templates drop-down list box. Each of them gives you a preset trace definition to work with. Leave the template name as SQLProfilerStandard. 5. Check the Save to File check box and click Save in the Save As dialog box to accept the default name and location. 6. Check the Save to Table check box, log in to the server again, and in the Destination Table dialog box fill in the following: • Database: Northwind • Table: Monitor 7. Click OK to return to the Trace property sheet.
Monitoring with SQL Profiler 7. Click the Events tab. 8. Under Available Event Classes, select Objects and click Add. This will monitor the opening and closing of objects such as tables. 9. Click the Data Columns tab to change the data you see in the trace. 10. Under Unselected Data, select End Time and click Add. 11. Click Run to start the trace.
Monitoring with SQL Profiler 12. Leave Profiler running and open Query Analyzer; log in using Windows Authentication. 13. Execute the following query: 14. USE Northwind SELECT * FROM products 15. Switch back to Profiler and click the Pause button (double blue lines). Notice the data that was collected by the trace.
Using the Index Tuning Wizard 1. Open Profiler. 2. From the Tools menu, select Index Tuning Wizard. This will open the Welcome screen. 3. Click Next and log in. 4. On the Select Server and Database screen, select Northwind as the database to tune. 5. Check Keep All Existing Indexes. 6. Check Thorough as the analysis type and click Next.
Using the Index Tuning Wizard 7. In the Specify Workload screen, click the My Workload File button. 8. In the File Open dialog box, select the Monitor trace (created earlier) and click OK to return to the Specify Workload screen, where you will see the Monitor file listed under My Workload File. 9. Click the Advanced Options button, note the defaults, and click OK. 10. Click Next. 11. In the Select Tables to Tune screen, click Select All Tables.
Using the Index Tuning Wizard 12. Click Next, and the wizard will start examining your indexes. 13. After SQL Server has finished examining your queries it displays a list of recommended indexes for you to create. Browse this list and click Next. 14. On the final screen, click Finish to end the wizard. 15. When you receive a message stating that the wizard has completed, click OK. 16. Exit Profiler.
Optimizing Techniques • Queries and Stored Procedures The first thing to ask yourself when you are getting slow response times is whether you could be using a stored procedure here instead of a client-side query. • Tempdb Tempdb should be between 25 and 40 percent of the size of your largest database Is your Tempdb big enough to handle the load that your queries put on it? Think of Tempdb as a scratchpad for SQL Server; when queries are performed, SQL Server uses this scratchpad to make notes about the result set • Query Governor Controlled by the Query Governor Cost Limit setting. This setting tells SQL Server not to run queries longer than x. Limit is set to 2, any query that is estimated to take longer than two seconds would not be allowed to run • Max Async I/O The maximum number of asynchronous input/output (Max Async I/O) threads by default in SQL Server is 32. That means that SQL Server can have 32 outstanding read and 32 outstanding write requests at a time • LazyWriter LazyWriter is a SQL Server process that moves information from the data cache in memory to a file on disk. Average Disk Queue Windows System Monitor counter and verify that it is not more than 2 per physical disk