Download
1 / 52
530 likes | 897 Vues
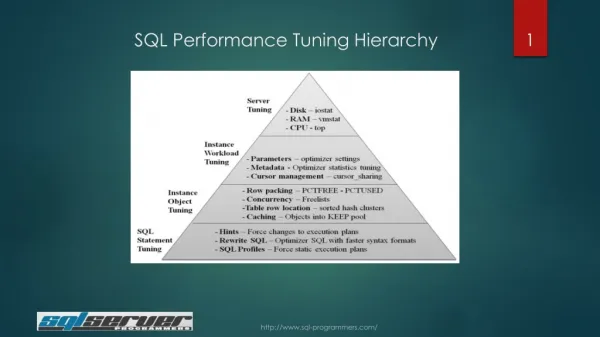
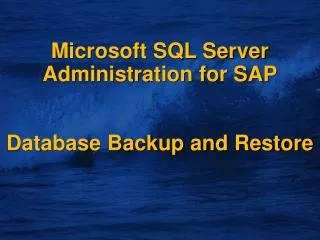
Microsoft SQL Server Administration for SAP Performance Monitoring and Tuning. SQL Server Architecture SQL Server with SAP Performance Monitoring and Tuning Administration and Troubleshooting Database Backup and Restore. Overview. Database Performance Analysis.

E N D
Microsoft SQL Server Administration for SAPPerformance Monitoring and Tuning
SQL Server Architecture SQL Server with SAP Performance Monitoring and Tuning Administration and Troubleshooting Database Backup and Restore Overview
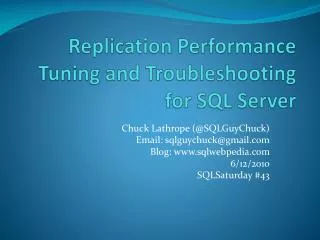
+ Cache and CPU Tuning ? Poor SQL statements? Tune poor statements Yes No 2 * CPU idle > CPU busy? Cache hit ratio > 95%? Increase CPUs forSQL Server Yes Yes No No OS paging? All CPUs available for SQL Server? No No Increase server main memory Add CPU(s) to server Yes Yes
Database Configuration • affinity mask • awe enabled • cost threshold for parallelism • max degree of parallelism • fillfactor • index create memory • lightweight pooling • Locks / open objects / connections • Max/Min server memory
max worker threads min memory per query network packet size / protocol priority boost query governor cost limit query wait recovery interval set working set size Database Configuration
Add / speed up I/O bus Add RAID + move disks Check disk + controller I/O System Tuning ? Slow RAID identified? Check all logical disks with NT perfmon No Yes Avg. disk queue length > 2 * phys. Disks in RAID RAID 5 and mostly write queue? No Decrease max async I/O Yes Yes Switch to RAID 0+1 Peak I/O on I/O bus < 133 MB/sec Peak I/O on RAID < 40 MB/sec Yes No No Yes Yes No
Server Configuration Poor configuration Hardware configuration Poor database configuration Main memory Disk layout Disks CPU Parameter settings Cache hit ratio Operating system paging Disk response times High I/O times CPUutilization >95% SQL Server CPU utilization DB error log Select 1 row via prim. key > 10 ms Page in > 100 MB / h Wait queue and low transfer rate 2 * idle > busy (total) 2 * idle > busy (SQL Server)
Dynamic Locking Isolationlevel Scan type (Range, Table, Probe) Locking strategy(Table, Page, Row) # of rows in scan # of rows/page Operation type (scan, update)
To lock a fine granule must place intent locks at higher granules Row Row Row Multi-Granular Locking T2: IS T1: IX Table T2: IS T1: IX Page Page Page T1: X T2: S
Lock Modes • Standard multi-granular lock modes Mode Description S Share - used for reading X Exclusive - typically used for writing U Update - used to evaluate prior to writing IS Intent Share - share locking at finer level IX Intent Exclusive - X locking at finer level SIX Share Intent Exclusive
HOW does SQL lock ? • How do you identify a lock? • Lock “resource” • Table “Authors” • Page 23 • Row with Key = “23812” • Lock manager knows nothing about resource format; it simply does a “memcmp()” • Lock resource format: Resource Type Database ID Resource Specific Data
Lock Resource Format • Example resource formats: • Table: • Page: • RowID: • Key: 5 5 325658 Object ID 6 5 2:328 File#: Page# File# : Page# : Slot on Page 9 5 2:328:11 Object ID : IndexId : 6byte Hash 7 5 325658:2:2341186 Resourcetype Database ID
New Lock Hints • Granularity Hints • ROWLOCK, PAGLOCK,TABLOCK • ISOLEVEL Hints • HOLDLOCK, NOLOCK • READCOMMITTED, REPEATABLEREAD, SERIALIZABLE, READUNCOMMITTED [All New]
New Lock Hints • READPAST • Useful for implementing work queues • UPDLOCK • Select for update • Deadlock due to select for update • Starving lock waits • LOCK_TIMEOUT(not a hint) • Application response time
sp_who, sysprocesses sp_locks SQL Profiler sp_indexoption Deadlock DBCC inputbuffer Kill Lock waits Latches Concurrency issue analysis
MARA Lockwait Situations 4. Work process Update MARA Requests MARA Lock WAITING ... 3. Work process Update MARA Requests MARA Lock Acquires MARA Lock WAITING! Working... 2. Work process Update MARA Requests MARA Lock Acquires MARA Lock WAITING! Working... Commit 1. Work process Update MARA Acquires MARA Lock A long period of processing Commit Time WP 1 WP 2 WP 3 Locked by:
Monitoring Lockwaits R/3 Lock Monitor
Unnecessary results Select with no where clause Select * instead of selecting few columns Queries not qualified properly Poorly written queries Missing index Old statistics Incorrect optimization Index Tuning Wizard Query issues
Space utilized by index Index maintenance overhead To cluster or not Bookmark lookup Range scan(OLTP Vs OLAP) Index columns Short & with high selectivity Often used in many statements Covered Multi index query Choosing index
Analyze query execution plan Analyze the right plan - connection settings spid, blocked, waittype, cpu physical_io, memusage, open_tran from sysprocesses Execution plan, read, write, duration in SQL Profiler Monitoring Query execution
Stats I/o Stats time Write your own trace Expected time / threshold Worktable Scan Vs Seek Monitoring Query execution
Query Hints Join, Index, Lock, Processing Distributed query execution TOP / SET ROWCOUNT FASTFIRSTROW IN / OR and subquery Selecting with alias Query execution
Cached execution plan Recompiled when stats changes Warning: Wrong Parameter to stored proc Binding parameter by position Set nocount sp_executesql Auto-parameterization in SQL7 sp_recompile Using stored procedures
Auto update stats Rowmodctr and StatVersion Fullscan and sampling Auto column stats Explicit update stats Explicit column stats sp_autostats Queue / log table sp_recompile Table statistics
Tuning Expensive SQL Statements Poor statement SQL Explain Where used list DDIC info Is there asuitableindex? GoodOptimizer decision? Inefficientcoding? Yes Yes No No Statistics page Yes Re-code Index statistics up to date? Autoupdate stats on? Yes Yes Update statistics No No Re-code or change index Switch on auto updstats