Download
1 / 1
10 likes | 157 Vues
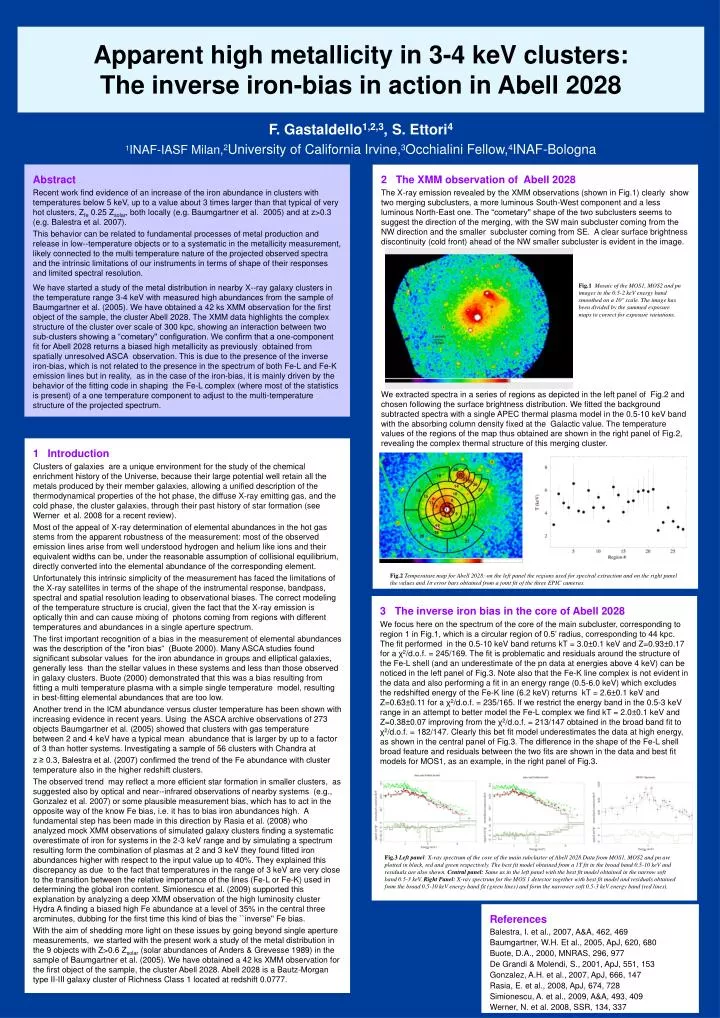
Apparent high metallicity in 3-4 keV clusters: The inverse iron-bias in action in Abell 2028. F. Gastaldello 1,2,3 , S. Ettori 4 1 INAF-IASF Milan, 2 University of California Irvine, 3 Occhialini Fellow, 4 INAF-Bologna. Abstract

E N D
Apparent high metallicity in 3-4 keV clusters: The inverse iron-bias in action in Abell 2028 F. Gastaldello1,2,3, S. Ettori4 1INAF-IASF Milan,2University of California Irvine,3Occhialini Fellow,4INAF-Bologna Abstract Recent work find evidence of an increase of the iron abundance in clusters with temperatures below 5 keV, up to a value about 3 times larger than that typical of very hot clusters, Zfe 0.25 Zsolar, both locally (e.g. Baumgartner et al. 2005) and at z>0.3 (e.g. Balestra et al. 2007). This behavior can be related to fundamental processes of metal production and release in low--temperature objects or to a systematic in the metallicity measurement, likely connected to the multi temperature nature of the projected observed spectra and the intrinsic limitations of our instruments in terms of shape of their responses and limited spectral resolution. We have started a study of the metal distribution in nearby X--ray galaxy clusters in the temperature range 3-4 keV with measured high abundances from the sample of Baumgartner et al. (2005). We have obtained a 42 ks XMM observation for the first object of the sample, the cluster Abell 2028. The XMM data highlights the complex structure of the cluster over scale of 300 kpc, showing an interaction between two sub-clusters showing a “cometary'' configuration. We confirm that a one-component fit for Abell 2028 returns a biased high metallicity as previously obtained from spatially unresolved ASCA observation. This is due to the presence of the inverse iron-bias, which is not related to the presence in the spectrum of both Fe-L and Fe-K emission lines but in reality, as in the case of the iron-bias, it is mainly driven by the behavior of the fitting code in shaping the Fe-L complex (where most of the statistics is present) of a one temperature component to adjust to the multi-temperature structure of the projected spectrum. 2 The XMM observation of Abell 2028 The X-ray emission revealed by the XMM observations (shown in Fig.1) clearly show two merging subclusters, a more luminous South-West component and a less luminous North-East one. The “cometary'' shape of the two subclusters seems to suggest the direction of the merging, with the SW main subcluster coming from the NW direction and the smaller subcluster coming from SE. A clear surface brightness discontinuity (cold front) ahead of the NW smaller subcluster is evident in the image. We extracted spectra in a series of regions as depicted in the left panel of Fig.2 and chosen following the surface brightness distribution. We fitted the background subtracted spectra with a single APEC thermal plasma model in the 0.5-10 keV band with the absorbing column density fixed at the Galactic value. The temperature values of the regions of the map thus obtained are shown in the right panel of Fig.2, revealing the complex thermal structure of this merging cluster. Fig.1Mosaic of the MOS1, MOS2 and pn images in the 0.5-2 keV energy band smoothed on a 10'' scale. The image has been divided by the summed exposure maps to correct for exposure variations. 1 Introduction Clusters of galaxies are a unique environment for the study of the chemical enrichment history of the Universe, because their large potential well retain all the metals produced by their member galaxies, allowing a unified description of the thermodynamical properties of the hot phase, the diffuse X-ray emitting gas, and the cold phase, the cluster galaxies, through their past history of star formation (see Werner et al. 2008 for a recent review). Most of the appeal of X-ray determination of elemental abundances in the hot gas stems from the apparent robustness of the measurement: most of the observed emission lines arise from well understood hydrogen and helium like ions and their equivalent widths can be, under the reasonable assumption of collisional equilibrium, directly converted into the elemental abundance of the corresponding element. Unfortunately this intrinsic simplicity of the measurement has faced the limitations of the X-ray satellites in terms of the shape of the instrumental response, bandpass, spectral and spatial resolution leading to observational biases. The correct modeling of the temperature structure is crucial, given the fact that the X-ray emission is optically thin and can cause mixing of photons coming from regions with different temperatures and abundances in a single aperture spectrum. The first important recognition of a bias in the measurement of elemental abundances was the description of the "iron bias“ (Buote 2000). Many ASCA studies found significant subsolar values for the iron abundance in groups and elliptical galaxies, generally less than the stellar values in these systems and less than those observed in galaxy clusters. Buote (2000) demonstrated that this was a bias resulting from fitting a multi temperature plasma with a simple single temperature model, resulting in best-fitting elemental abundances that are too low. Another trend in the ICM abundance versus cluster temperature has been shown with increasing evidence in recent years. Using the ASCA archive observations of 273 objects Baumgartner et al. (2005) showed that clusters with gas temperature between 2 and 4 keV have a typical mean abundance that is larger by up to a factor of 3 than hotter systems. Investigating a sample of 56 clusters with Chandra at z ≥ 0.3, Balestra et al. (2007) confirmed the trend of the Fe abundance with cluster temperature also in the higher redshift clusters. The observed trend may reflect a more efficient star formation in smaller clusters, as suggested also by optical and near--infrared observations of nearby systems (e.g., Gonzalez et al. 2007) or some plausible measurement bias, which has to act in the opposite way of the know Fe bias, i.e. it has to bias iron abundances high. A fundamental step has been made in this direction by Rasia et al. (2008) who analyzed mock XMM observations of simulated galaxy clusters finding a systematic overestimate of iron for systems in the 2-3 keV range and by simulating a spectrum resulting form the combination of plasmas at 2 and 3 keV they found fitted iron abundances higher with respect to the input value up to 40%. They explained this discrepancy as due to the fact that temperatures in the range of 3 keV are very close to the transition between the relative importance of the lines (Fe-L or Fe-K) used in determining the global iron content. Simionescu et al. (2009) supported this explanation by analyzing a deep XMM observation of the high luminosity cluster Hydra A finding a biased high Fe abundance at a level of 35% in the central three arcminutes, dubbing for the first time this kind of bias the ``inverse'' Fe bias. With the aim of shedding more light on these issues by going beyond single aperture measurements, we started with the present work a study of the metal distribution in the 9 objects with Z>0.6 Zsolar (solar abundances of Anders & Grevesse 1989) in the sample of Baumgartner et al. (2005). We have obtained a 42 ks XMM observation for the first object of the sample, the cluster Abell 2028. Abell 2028 is a Bautz-Morgan type II-III galaxy cluster of Richness Class 1 located at redshift 0.0777. Fig.2 Temperature map for Abell 2028: on the left panel the regions used for spectral extraction and on the right panel the values and 1σ error bars obtained from a joint fit of the three EPIC cameras. 3 The inverse iron bias in the core of Abell 2028 We focus here on the spectrum of the core of the main subcluster, corresponding to region 1 in Fig.1, which is a circular region of 0.5’ radius, corresponding to 44 kpc. The fit performed in the 0.5-10 keV band returns kT = 3.0±0.1 keV and Z=0.93±0.17 for a χ2/d.o.f. = 245/169. The fit is problematic and residuals around the structure of the Fe-L shell (and an underestimate of the pn data at energies above 4 keV) can be noticed in the left panel of Fig.3. Note also that the Fe-K line complex is not evident in the data and also performing a fit in an energy range (0.5-6.0 keV) which excludes the redshifted energy of the Fe-K line (6.2 keV) returns kT = 2.6±0.1 keV and Z=0.63±0.11 for a χ2/d.o.f. = 235/165. If we restrict the energy band in the 0.5-3 keV range in an attempt to better model the Fe-L complex we find kT = 2.0±0.1 keV and Z=0.38±0.07 improving from the χ2/d.o.f. = 213/147 obtained in the broad band fit to χ2/d.o.f. = 182/147. Clearly this bet fit model underestimates the data at high energy, as shown in the central panel of Fig.3. The difference in the shape of the Fe-L shell broad feature and residuals between the two fits are shown in the data and best fit models for MOS1, as an example, in the right panel of Fig.3. Fig.3Left panel: X-ray spectrum of the core of the main subcluster of Abell 2028 Data from MOS1, MOS2 and pn are plotted in black, red and green respectively. The best fit model obtained from a 1T fit in the broad band 0.5-10 keV and residuals are also shown. Central panel: Same as in the left panel with the best fit model obtained in the narrow soft band 0.5-3 keV. Right Panel: X-ray spectrum for the MOS 1 detector together with best fit model and residuals obtained from the broad 0.5-10 keV energy band fit (green lines) and form the narrower soft 0.5-3 keV energy band (red lines). References Balestra, I. et al., 2007, A&A, 462, 469 Baumgartner, W.H. Et al., 2005, ApJ, 620, 680 Buote, D.A., 2000, MNRAS, 296, 977 De Grandi & Molendi, S., 2001, ApJ, 551, 153 Gonzalez, A.H. et al., 2007, ApJ, 666, 147 Rasia, E. et al., 2008, ApJ, 674, 728 Simionescu, A. et al., 2009, A&A, 493, 409 Werner, N. et al. 2008, SSR, 134, 337