Download
1 / 1
10 likes | 104 Vues
1. Introduction and research aim Vertical travel time ( Tt v ) of water and conservative solutes to groundwater causes time lag between implementation of management practices and changes in groundwater quality (Fig. 1)

E N D
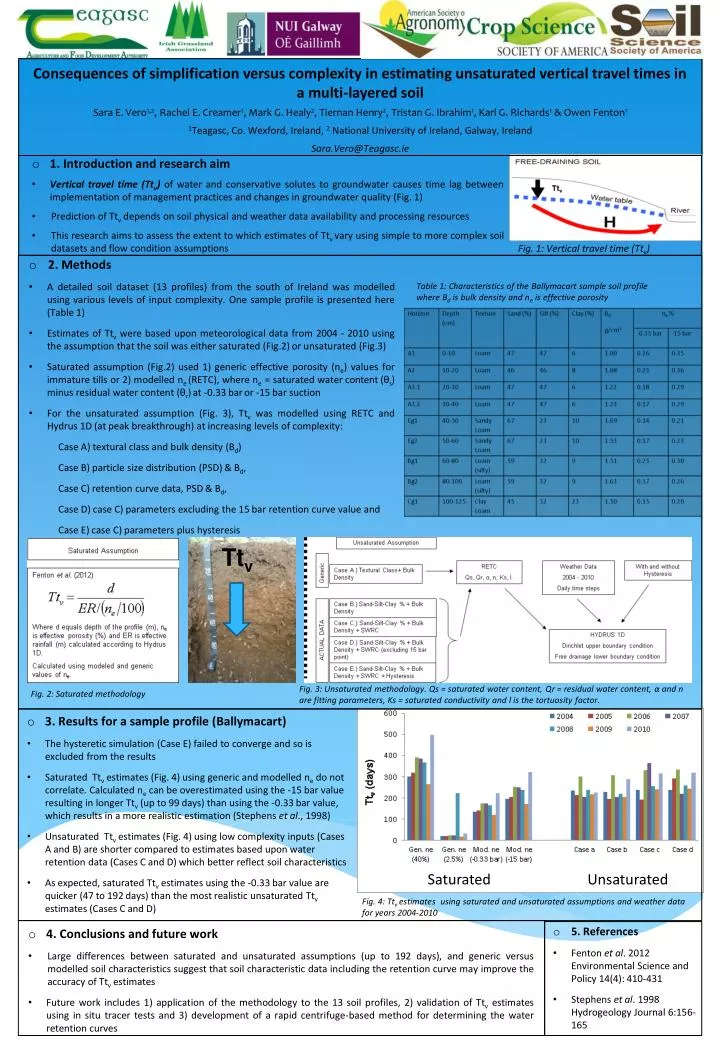
1. Introduction and research aim • Vertical travel time (Ttv) of water and conservative solutes to groundwater causes time lag between implementation of management practices and changes in groundwater quality (Fig. 1) • Prediction of Ttv depends on soil physical and weather data availability and processing resources • This research aims to assess the extent to which estimates of Ttvvary using simple to more complex soil datasets and flow condition assumptions Fig. 1: Vertical travel time (Ttv) • 2. Methods • A detailed soil dataset (13 profiles) from the south of Ireland was modelled using various levels of input complexity. One sample profile is presented here (Table 1) • Estimates of Ttv were based upon meteorological data from 2004 - 2010 using the assumption that the soil was either saturated (Fig.2) or unsaturated (Fig.3) • Saturated assumption (Fig.2) used 1) generic effective porosity (ne) values for immature tills or 2) modelled ne (RETC), where ne = saturated water content (θs) minusresidual water content (θr)at -0.33 baror -15 bar suction • For the unsaturated assumption (Fig. 3), Ttvwas modelledusing RETC and Hydrus 1D (at peak breakthrough) at increasing levels of complexity: • Case A) textural class and bulk density (Bd) • Case B) particle size distribution (PSD) & Bd, • Case C) retention curve data, PSD & Bd, • Case D) case C) parameters excluding the 15 bar retention curve value and • Case E) case C) parameters plus hysteresis Table 1: Characteristics of the Ballymacart sample soil profile where Bd is bulk density and ne is effective porosity Ttv Consequences of simplification versus complexity in estimating unsaturated vertical travel times in a multi-layered soil Sara E. Vero1,2, Rachel E. Creamer1, Mark G. Healy2, Tiernan Henry2, Tristan G. Ibrahim1, Karl G. Richards1 & Owen Fenton1 1Teagasc, Co. Wexford, Ireland, 2 National University of Ireland, Galway, Ireland Sara.Vero@Teagasc.ie Fig. 3: Unsaturated methodology. Qs = saturated water content, Qr= residual water content, α and n are fitting parameters, Ks = saturated conductivity and l is the tortuosity factor. Fig. 2: Saturated methodology • 3. Results for a sample profile (Ballymacart) • The hysteretic simulation (Case E) failed to converge and so is excluded from the results • Saturated Ttv estimates (Fig. 4) using generic and modelled nedo not correlate. Calculated ne can be overestimated using the -15 bar value resulting in longer Ttv (up to 99 days) than using the -0.33 bar value, which results in a more realistic estimation (Stephens et al., 1998) • Unsaturated Ttvestimates (Fig. 4) using low complexity inputs (Cases Aand B) are shorter compared to estimates based upon water retention data (Cases Cand D) which better reflect soil characteristics • As expected, saturated Ttv estimates using the -0.33 bar value are quicker (47 to 192 days) than the most realistic unsaturated Ttvestimates (Cases C and D) Saturated Unsaturated Fig. 4: Ttvestimates using saturated and unsaturated assumptions and weather data for years 2004-2010 • 5. References • Fenton et al. 2012 Environmental Science and Policy 14(4): 410-431 • Stephens et al. 1998 Hydrogeology Journal 6:156-165 • 4. Conclusions and future work • Large differences between saturated and unsaturated assumptions (up to 192 days), and generic versus modelled soil characteristics suggest that soil characteristic data including the retention curve may improve the accuracy of Ttvestimates • Future work includes 1) application of the methodology to the 13 soil profiles, 2) validation of Ttvestimates using in situ tracer tests and 3) development of a rapid centrifuge-based method for determining the water retention curves