Download
1 / 12
120 likes | 269 Vues
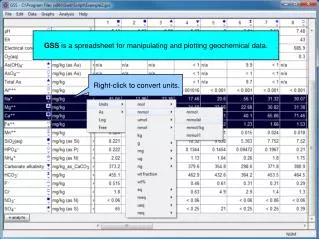
GSS is a spreadsheet for manipulating and plotting geochemical data. Right-click to convert units. Calculate mineral saturation, species concentration, gas fugacity, and more. Click “+ analyte” → Calculate... → Mineral Saturation. Graphs → Time Series Plot.

E N D
GSS is a spreadsheet for manipulating and plotting geochemical data. Right-click to convert units.
Calculate mineral saturation, species concentration, gas fugacity, and more. Click “+ analyte” → Calculate... → Mineral Saturation...
Graphs → Time Series Plot Display your data in Time Series and XY Plots
Graphs → Piper Diagram Analyze samples using standard water chemistry diagrams.
Rxn balances chemical reactions, calculates equilibrium constants, and more. Choose species to appear on left side of reaction Balance reactions with these entries
Balanced reaction Balanced reaction Equilibrium constants Equilibrium equation
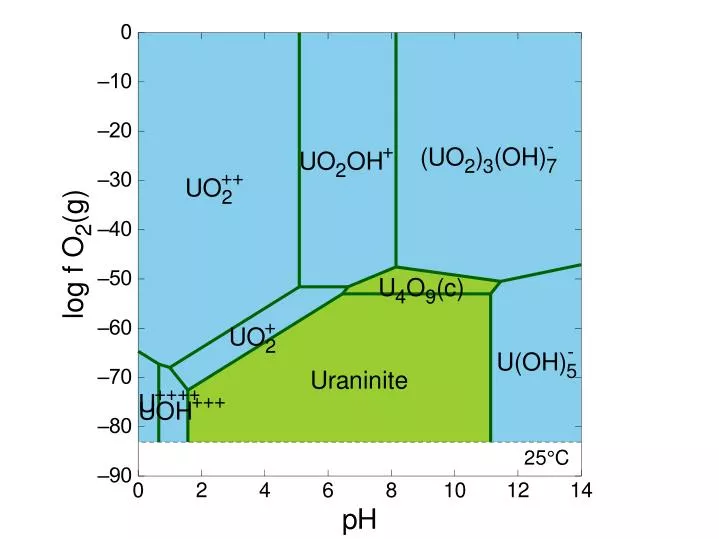
Choose main species to diagram. Diagram axes Act2 generates stability diagrams on activity, Eh, pe, pH, and fugacity axes.
Edit your plots, then copy and paste into your documents.
Tact makes temperature-activity and temperature-fugacity diagrams. You can account for the speciation of complexing ligands.
SpecE8 figures concentrations of aqueous and sorbed species, mineral saturation, and gas fugacity. Enter your fluid composition on the Basis pane.
View printed or plotted results characterizing your water samples Program output shows the distribution of species.