Download
1 / 11
110 likes | 238 Vues
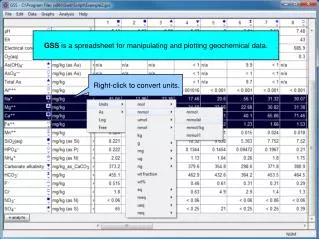
GSS is a spreadsheet for manipulating and plotting geochemical data. Right-click to convert units. Enter chemical data for one or more samples, then use GSS to calculate additional analytes. + analyte → Calculate. Variable → Mineral saturation. Choose minerals.

E N D
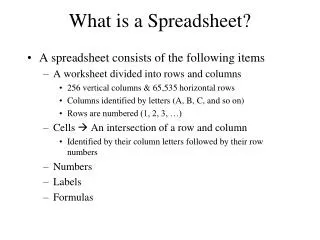
GSS is a spreadsheet for manipulating and plotting geochemical data. Right-click to convert units.
Enter chemical data for one or more samples, then use GSS to calculate additional analytes. + analyte → Calculate...
Variable → Mineral saturation... Choose minerals Calculated Mineral saturation appears below original data for each sample.
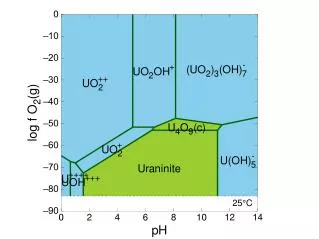
Compute gas fugacities CO2(g) fugacity is added to the analytes section.
Figure aqueous species distribution Select species
Compare replicate samples with themselves or with a standard. Enter data for each sample then go to Analysis... Choose samples to compare and enter error tolerance.
Check marks indicate a small coefficient of variance between replicates. X's appear where the error tolerance is exceeded.
Graphs → Time Series Plot Display your data in Time Series and XY Plots
Graphs → Piper Diagram Analyze samples using standard water chemistry diagrams.