Download
1 / 44
440 likes | 442 Vues
Learn about the power law distributions, the bowtie model, human users and businesses, design models and metrics, and more in this comprehensive guide to the web graph and the laws that govern it.

E N D
What is ‘The Web’? • A distributed document delivery service implemented using application-level protocols on the Internet • A tool for collaborative writing and community building • A framework of protocols that support e-commerce • A network of co-operating computers interoperating using HTTP and related protocols to form a sub-net of the Internet • A large, cyclical, directed graph made up of webpages and links
Web Graph http://www.touchgraph.com/TGGoogleBrowser.html
The Web Graph &The Laws of The Web • Power Law Distributions • The Bowtie model • Human users, and Businesses • Design Models and Metrics • Examples of Website Maps • Hierarchization: How to Compute Centrality
The Web Graph &The Laws of The Web 1. Power Law Distributions
Power Law Distributions • For large values of independent var. x, the distribution decays polynomially as x-, with >1 • Different from other common distribs: • Exponential • Gaussian (normal) • Poisson • In PLDs rare events are not so rare • Majority of points are above the average Baldi et al., p.22
Classes of small-scale Networks • Scale-free: Power-law distribution of connectivity over entire range • Broad-scale: Power-law over “broad range” & abrupt cut-off • Single-scale: Connectivity distribution decays exponentially
Power Law Distrib. Example • Averages are not suitable for prediction • The same patterns occur again and again (although with different specifics) Huberman, p.46, Fig. 5.1
PLDs are Scale-Free • The shape of the distribution is identical at all scales • A small sample can accurately predict the entire distribution • We can use crawl results from search engines to estimate size and other characteristics of the entire WWW Baldi et al., pp.24, 45–46
PLDs are Scale-Free • In 1997 overlap analysis found that: • WWW had 320106 web pages • 60% was indexed by 1 of 6 search engines • The most any search engine covered was one-third of the WWW • We can use crawl results from search engines to estimate size and other characteristics of the entire WWW Baldi et al., pp.24, 45–46
The Web Graph &The Laws of The Web 2. The Bowtie Model A Common Scale-less Property
Hubs & Authorities • Hubs and Authorities form bipartite graphs • Hubs are central resources that link out to many nodes (e.g. Yahoo!) • Authorities are linked into by many nodes • Technically they are pointed to by many hubs • Why is this useful? • Specialized search engines for example
Authority and Hubnessfrom Baldi et al. 5 2 3 1 6 1 4 7 h(1) = a(5) + a(6) + a(7) a(1) = h(2) + h(3) + h(4)
Macro-level Nodesaka Clumps or Knots Van Dyke Parunak (1991)
Macro-level Nodesaka Clumps or Knots These are all ‘small worlds’ Van Dyke Parunak (1991)
Macro-level Nodesaka Clumps or Knots Van Dyke Parunak (1991)
Bowtie Model of the WWW Baldi et al., p.59, Fig. 3.1
Bow-tie Componentsfrom Baldi et al. • Strongly Connected Component (SCC) • Core with small-world property (everywhere in a SW is just a few links away) • Upstream (IN) • Core can’t reach IN • Downstream (OUT) • OUT can’t reach core • Disconnected (Tendrils)
The Web Graph &The Laws of The Web 3. Human Users, and Businesses
Human/Information Web Properties: Communities • Cliques and Communities • Highly interlinked knots • ‘A cluster of nodes such that the density of links between members of the community (in either direction) is higher than the density of links between members of the community and the rest of the network.’ (Baldi, et al. p.71)
Business Concern: Stickiness • Portal business model has 2 sources of income: • Direct sales • Advertising sales • Requires a ‘captive audience’ • Advertisers want many visitors to see their ads • Advertisers like to have a predictable audience for their ads Huberman’s The Laws of The Web (p.49)
Stickiness • Portals want visitors to use the site lots • Lots of time and • Lots of page loads • How to ensure this? • Make the site ‘sticky’ • Sticky sites are those that users want to use for a long time • Added functionality to encourage engagement (discussion fora, games, tags, etc.) • Force users to click through many pages (‘this news story continues on next webpage’, splash page, no deep linking, etc.) Huberman’s The Laws of The Web (p.49)
The Web Graph &The Laws of The Web 4. Design Models and Metrics for Individual Websites
Graph-based Characterization of Websites • Node properties: • Centrality (in-c.authority, out-chub) • Depth • Imbalance • Global properties • Hierarchality • Compactness (how connected is the graph) • Stratum (how linear is the graph) Botafogo, et al. (Apr. 1992). Structural Analysis of Hypertexts: Identifying hierarchies and useful metrics. ACM Trans. Information Systems, 10(2):142–180. <URL:http://doi.acm.org/10.1145/146802.146826>.
A Simple View of Website Structure Brockmann et al. (1989). From Database to Hypertext via Electronic Publishing: An Information Odyssey. In Barrett (ed.) The Society of Text: Hypertext, Hypermedia, and the Social Construction of Information. Figure 16
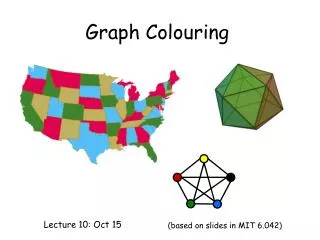
Hierarchization:Untangling knotty webs a b c d e f Rivlin, et al., (Feb. 1994). Navigating in Hyperspace: Designing a structure-based toolbox. CACM, 37(2), 2:87–96. <URL:http://doi.acm.org/10.1145/175235.17524>. Figure 2a
Hierarchization c a b c d a b d e e f f f Rivlin, et al., (Feb. 1994). Navigating in Hyperspace: Designing a structure-based toolbox. CACM, 37(2), 2:87–96. <URL:http://doi.acm.org/10.1145/175235.17524>. Figure 2
Hierarchization c a b c d a b d e e f f f Rivlin, et al., (Feb. 1994). Navigating in Hyperspace: Designing a structure-based toolbox. CACM, 37(2), 2:87–96. <URL:http://doi.acm.org/10.1145/175235.17524>. Figure 2
Hierarchization withCross-reference Links c a b c d a b d e e f f f Rivlin, et al., (Feb. 1994). Navigating in Hyperspace: Designing a structure-based toolbox. CACM, 37(2), 2:87–96. <URL:http://doi.acm.org/10.1145/175235.17524>. Figure 2
Hierarchization withCross-reference Links c a b c d a b d e e f f f Rivlin, et al., (Feb. 1994). Navigating in Hyperspace: Designing a structure-based toolbox. CACM, 37(2), 2:87–96. <URL:http://doi.acm.org/10.1145/175235.17524>. Figure 2
Nodes in two places?! c c a b d e a b d e f f f
Where Am I?Map views of Websites Introduction Collaboration with Industry Fields of Research Center for Automation Research Research in Vision Rosenfeld, Azriel Rosenfeld, Azriel Rivlin, et al., (Feb. 1994). Navigating in Hyperspace: Designing a structure-based toolbox. CACM, 37(2), 2:87–96. <URL:http://doi.acm.org/10.1145/175235.17524>. Figure 4
Types of Website Maps • Breadcrumb lists • CS4173 examples • Sitemap lists • CS4173 sitemap • Sitemap pictures • CS4173 sitemap • Multi-dimensional pictures • Colour, size, and position • Dynamic Diagrams, Inc. Examples in picture form follow…
‘A portion of the Javasoft Web site as rendered by MAPA, a data-driven Web site map system.’ — Martin Dodge at Mappa Mundi website
Hierarchization: How To • Identify central node • Greatest number of out-links (hub) • Greatest number of in-links (authority) • Move it to top • Create/Re-Create links • Links that exist and follow hierarchical model stay • Other links are shortcuts • Decide to duplicate or not
Shortest Path Matrix(M) (An example from Rivlin et al.)
Converted Distance Matrix (C) A typical value for K is the number of nodes (An example from Rivlin et al.)
Converted Outdegree = row (An example from Rivlin et al.)
Converted Out Degree (COD) Relative Out Centrality (ROC) • ROC & COD indicate how easy it is to reach other nodes from the current node • ROC is COD (converted out centrality) normalized using CD (converted distance) • CD = sum of all converted distances • Normalization is used for comparing hypertexts (e.g. websites)
Relative Out Centrality = CD/COD (An example from Rivlin et al.)