Download
1 / 12
120 likes | 280 Vues
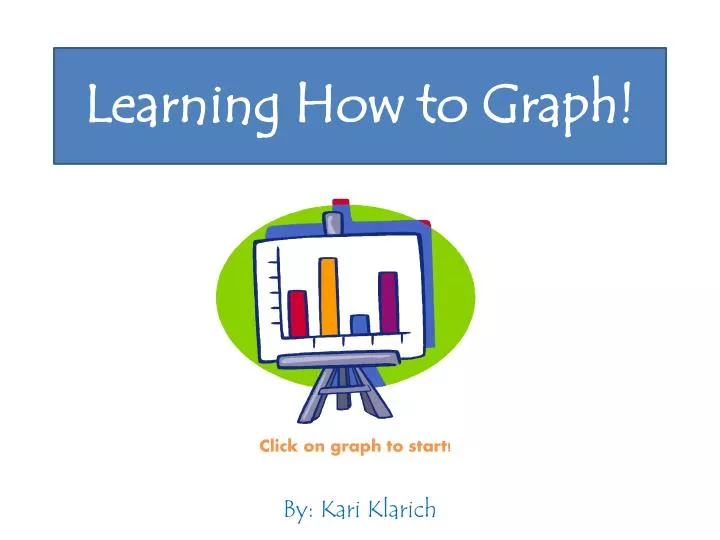
Learning How to Graph!. By: Kari Klarich. Click on graph to start!. What You Need to Know About Graphing:. What is a Graph? Collecting and Organizing Data Ideas of What You Can Graph How to Graph Different Kinds of Graphs (Click on one of the icons above to learn about graphing).

E N D
Learning How to Graph! By: Kari Klarich Click on graph to start!
What You Need to Know About Graphing: What is a Graph?Collecting and Organizing Data Ideas of What You Can Graph How to Graph Different Kinds of Graphs (Click on one of the icons above to learn about graphing)
What’s a Graph? Watch this movie to learn about graphs!
Some Ideas of What You Can graph: What is your favorite holiday? What is your favorite candy bar? Christmas, Halloween, or Valentines Day. Snickers, Reese's, or Twix. How do you feel today? What is your favorite sport? Happy, Frustrated, Tired. Basketball, Baseball, or Soccer. (Click on an icon above to see different examples of graphs.)
How Do You Feel Today? Picture Graph = 8 = 3 = 2 • Picture graphs are a fun way to graph for everyone! Use pictures that represent each topic you are graphing. Each picture represents a vote for that item. Try to pick pictures that go with the topic you choose. Notice how each picture in the picture graph above reflects the mood listed. Use the information above to see if you can answer the questions below: • How many students were asked how they were feeling today? • How many students were feeling happy today? • Was at least half the class happy today?
What is Your Favorite Sport? Pie Graph Mike Matt Suzy John Todd Bill Jill Sara Kim Ana Bob Sam Carla Mark Lisa • This is an example of a pie graph. There are many ways you can graph a pie graph. This is an example of the students writing their names in the column of their favorite sport. With the information above, see if you can answer the questions below: • How many students were asked their favorite sport? • Which two sports are equally popular with the students? • How many more students liked basketball better than baseball?
What is Your Favorite Candy Bar? Tally Graph • The graphs above are examples of a line graph, and a tally graph. With the information above, see if you can answer the questions below: • How many students were asked their favorite candy bar? • Which candy bar was the most popular? • How many more students liked Twix better than Reese’s?
What is Your Favorite Holiday? • Above are examples of a bar graph and a pie graph. This shows that the same information was graphed in both examples. Can you answer the questions below by looking at the graphs above? • How many students were asked their favorite holiday • What was the most popular holiday? • Did more students like Halloween or Valentines Day better? • How many more students liked Christmas more than Halloween?
Collecting and Organizing Data: Steps On How to Collect and Organize Data: • Think of a question that has at least two choices for the answer, and write it down on a piece of paper. If you are having a hard time thinking of an idea, go back to the page titled “Ideas of What You can Graph”. • Organize the choices into separate columns on a piece of paper. • Ask as many people as you want to answer your question with the choices you have listed. When they answer, either write down their name or a tally into the correct column they picked. • When you have finished surveying people, take time to look at the information you wrote down. Count up how many people chose each column and write amount in each column. • Now that you have collected and organized your data, look at the page “How to Graph”.
How to Graph: • Pick one of your favorite graphs we have learned about: Bar, pie, Line, tally, or picture graph. • Once you have chosen a graph, make sure you label each column correctly. Don’t forget to put a title on your graph! (use a ruler if necessary to make sure you graph is neat and orderly.) • Then you will take the information you collected/organized, and put it in the correct columns. • Make sure your graph is put together and organized in a way that others can understand. • When you are finished, ask yourself questions about your graph to make sure it makes sense and information is in correct spot. When you are done creating your graph make sure you share it with friends and family! Now that you have learned a little about graphing, click on the pie graph to the left to play some graphing games.
Different Kinds of Graphs: Picture Graph Tally Graph
Additional Information Core Standards Citations/References www.uen.org Where Do I Fit on the Graph? www.eduplace.com Graphing Data Overview www.mytestbook.com Tally Charts www.nlvm.usu.edu Natural Library of Virtual Manipulatives www.youtube.com What a Graph: Video 2nd Grade Math Standard 3 Objective 3 Collect, record, organize, display and interpret numerical data.