Download
1 / 13
130 likes | 279 Vues
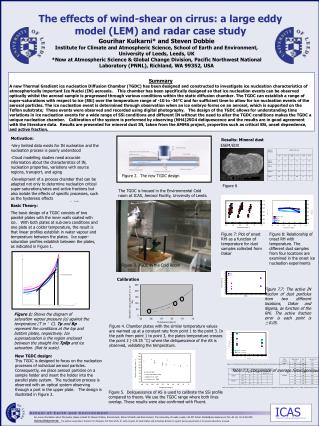
Analysis of wind shear for the ExoMars mission using ultra-high resolution Large Eddy Simulation. T. Bertrand, A. Spiga , A. Colaïtis. Mission context. ExoMars ESA mission 2016: - TGO - EDM Landing point: Meridiani Planum ̴ 1.88°S / 353.87E. Objectives.

E N D
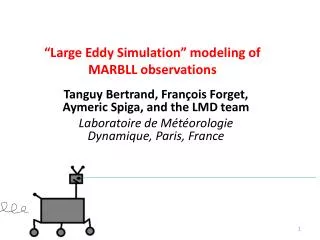
Analysis of wind shear for the ExoMars mission using ultra-high resolution Large Eddy Simulation T. Bertrand, A. Spiga, A. Colaïtis
Mission context ExoMars ESA mission 2016: - TGO - EDM Landing point: MeridianiPlanum ̴ 1.88°S / 353.87E
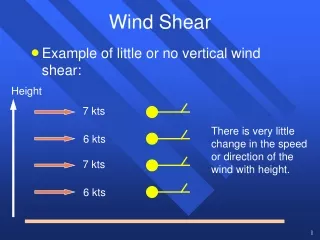
Objectives EvaluatewindshearsatExoMars landing site Definition: A strong wind shear at an atmospheric level results either from large differences of wind amplitude or contrasts in wind direction, or both, over a small vertical extent.
Objectives EvaluatewindshearsatExoMars landing site Possible effect of a windshear on EDM’s landing system: Large Eddy Simulation: 400 levelsbetween 0 and 5 km altitude Vertical resolution =12.5 m LCT = 1 p.muntil 1.45 p.m Horizontal resolution = 12 m Wind shear
Wind vector V θ Wind shearcharacterization U V UV (alt = n) D(UV) Δ(θ) UV (alt = n+1) U D(UV) enables to evaluate the combinedeffects of angle and amplitude. It is a good indicator of windshears.
Altitude (m) Vertical discretization 12.5 m 12.5 m 12.5 m In order to constrain the mission, we are concernedwithwindshearsoccuring over a vertical distance of 20-30 m UV (m/s) 13 6 7
Exemple of windshears with UV and θprofiles Wind shear with high Δ(UV) Wind shear with high Δθ Altitude (km) (°) Δ(UV) Δθ
Δ(UV) and Δ(θ) at 4 different times and at two different locations (distant from 750m)
Maximal values of D(UV) Between 0-5 km and 0100PM-0145PM D(UV) [ s-1 ]
Extreme cases of wind shear profiles D(UV)= 0.42 s-1 (15.7 m.s-1 over 37,5m) High Δθ Red curve: sheared case Blue curve: smooth case Altitude (km) Δ(UV) D(UV) Δθ
Probability of windshear Considering maximal values of D(UV) only max (s-1)
Probability of windshear Considering all values of D(UV) from LES max (s-1)
Conclusions • Wind shears diagnostic D(UV) … combining gradient of wind amplitude and wind direction. • Most plausible ExoMarslanding profiles have very moderate shears (< 3 m.s-1 over a vertical distance of 37.5 m). • Amajority of maximal shears are between 0.15 and 0.25 s-1. • Extreme wind shears of about 15 m.s-1are found over a vertical distance of 37.5 m (but low probability: P < 0.01). • On the one hand, the probability of having wind shears less than 0.1 s-1 is quite high when considering all times and altitudes available. When considering only maximal wind shears over the same area, a majority of wind shears between 0.15 and 0.25 s-1 are found. In a general way, over a vertical distance of 37.5 m, variations of wind amplitude of 3 m.s-1 combined with angle variation of about 60° are relatively frequent.