Download
1 / 24
240 likes | 383 Vues
Poverty Mapping Celia M. Reyes Introduction to Poverty Analysis NAI, Beijing, China Nov. 1-8, 2005. Poverty Mapping. Poverty analysis is often based on national level indicators that are compared over time or across countries.

E N D
Poverty Mapping Celia M. Reyes Introduction to Poverty Analysis NAI, Beijing, China Nov. 1-8, 2005
Poverty Mapping • Poverty analysis is often based on national level indicators that are compared over time or across countries. • The broad trends that can be identified using aggregate information are useful for evaluating and monitoring the overall performance of a country. • For many policy and research applications, however, the information that can be extracted from aggregate indicators may not be sufficient, since they hide significant local variation in living conditions within countries.
Poverty Mapping • For example, poverty within a region can vary across districts. This makes small-area estimates of poverty very appealing. • However, often we are unable to compute poverty estimates for small areas like districts. Instead, we usually have poverty estimates for regions or entire countries only.
Poverty Mapping • The main reason that poverty measures are computed for large areas and not usually available for small areas is due to data availability.
Poverty Mapping • There are two main types of welfare related information sources available to policy-makers. • Household surveys often include a detailed income and/or consumption expenditure module (such as the CSES 1999). However, due to relatively small sample size, the collected information is usually only representative for broad regions of the country. For example, with the CSES 1999 we can compute poverty estimates for Phnom Penh, other urban areas and rural areas but not for every district.
Poverty Mapping • Census data (and sometimes large household sample surveys) are available for all households (or very large samples of households) and can provide reliable estimates at highly disaggregated levels such as small municipalities, towns, and villages. But censuses do not contain the necessary income or consumption information to yield reliable indicators of the level and distribution of welfare such as poverty rates or inequality measures.
Poverty Mapping • More recently, some researchers are developing statistical techniques to merge information from these two types of data sources (detailed household surveys like the CSES 1999, and census data) so that “poverty maps” can be constructed. These detailed poverty maps will be appealing for several reasons. • Poverty maps capture the heterogeneity of poverty within a country, i.e., areas that are better off and those that are worse off will be more clearly defined. Sometime regions that have less aggregate poverty may have substantially pockets of poverty which is lost in the aggregate poverty statistics.
Poverty Mapping • Poverty maps can improve targeting of interventions. In designing poverty alleviation projects and allocating subsidies, resources will be used more effectively, if the most needy groups can be better targeted. This reduces the leakage of transfer payments to non-poor persons, and it reduces the risk that poor persons will be missed by a program. • Many countries use geographic targeting schemes based on relatively unreliable welfare indicators such as the “basic needs indicators”, which are ad hoc combinations of various indicators into one index.
Poverty Mapping • Poverty maps can help governments to articulate their policy objectives. Basing allocation decisions on observed geographic poverty data rather than subjective rankings of regions increases the transparency of government decision making. Such data can thus help limit the influence of special interests in allocation decisions. There is a related role for well-defined poverty maps to lend credibility to government and donor decision making.
Poverty Mapping • This new method combines the respective strengths of survey and census data to estimate welfare indicators for small administrative or statistical areas. • The approach uses household survey data to estimate a model of per capita consumption expenditure (or any other household or individual-level indicator of well-being) as a function of variables that are common to both the household survey and the census.
Poverty Mapping • The resulting parameter estimates from this first-stage regression are then used to predict per capita expenditures for each household in the census. • The estimated household level measures of poverty and inequality are then aggregated for small areas, such as districts, villages, or even neighborhoods.
Poverty Mapping Example: Poverty mapping done by World Food Programme in Cambodia to identify “poor” communes
Multiple regression on Socioeconomic Survey (3000 households) Consumption Expenditure as explained by: • household size • age of household head • education level • proportion of elderly • widowed head of household • occupation of head of household • electricity source • water source • urban household • distance to main road
Coefficients plugged into Census 98 (2.1 million households) Same indicators from census • household size • age of household head • education level • proportion of elderly • widowed head of household • occupation of head of household • electricity source • water source • urban household • distance to main road
To derive predicted consumption expenditure for each household. The estimated household-level measures of poverty and inequality may then be aggregated for small areas, such as districts, villages, or even neighborhoods.
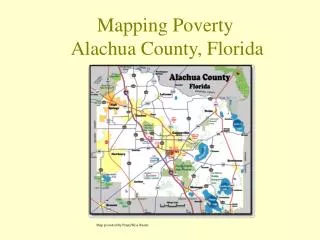
Ecuador has about 400 cantons and over 1,000 parishes (parroquias). The purpose of the exercise was to get poverty rates for each parish in the country. In principle this would allow a relatively finely-tuned targeting of the poorer parts of the country. Poverty Mapping In Ecuador [1] Jesko Hentschel, Jean Olson Lanjouw, Peter Lanjouw and Javier Poggi, “Combining Census and Survey Data to Trade the Spatial Dimensions of Poverty: A Case Study of Ecuador,” The World Bank Economic Review, 14(1): 147-166.
The 1994 Encuesta sobre las Condiciones de Vida (a living standards measurement survey) obtained 4,391 usable responses from households, which was clearly inadequate for measuring poverty at the level of each parish or even canton. However, the 1990 census counted about 2 million households, and collected information on a range of demographic variables such as household size, age, education, occupation, housing quality, language and location Box: Poverty Mapping In Ecuador
The research team used the data from the Encuesta to estimate regressions of the form Ln yi = X’i + i for each region of the country. The dependent variable was income per capita, and the independent variables were comparable to ones that were also available from the census. With R2 values of about 0.5, the fits were adequate. Then data from the census for each household were used in the equation in order to predict income for each household, and poverty rates computed for each parish. Box: Poverty Mapping In Ecuador
The main finding what that while the poverty rates for each of the broad regions are robust, the same is not true of the poverty rates by parish, where the standard errors of the estimates are relatively high. In an important test of the robustness of poverty mapping, the authors re-estimated the income equation using part of the Encuesta sample, predicted income for all households that were not included in the estimation (the validation sample), and then compared the predicted income with actual income. These out-of-sample predictions proved to be quite close to the actual values. Box: Poverty Mapping In Ecuador
In another test, Hentschel at al. simulated the effect of providing subsidies to the poorest parishes, and then asked what proportion of these benefits went to each income quintile. The results are reproduced here, and show that 77% of the subsidies would have gone to households in the lowest two quintiles – a respectably high level of successful targeting. Box: Poverty Mapping In Ecuador
Their conclusion? “The most useful practical application of this methodology is probably in making comparisons with regional patterns of other indicators of well-being, opportunity, and access” (Hentschel et al., p.162). Thus, for instance, one could map health indicators against estimated income at the regional level, and find a close and useful link. Box: Poverty Mapping In Ecuador
Use of Geographical Information System (GIS) • To highlight spatial differences in indicators
Community Based Monitoring Systems (CBMS) • Alternative to methodology described previously. • Features of CBMS: • Data collected by the communities • Covers a set of socio-economic indicators • Data used for planning and program implementation