Download
1 / 1
20 likes | 162 Vues
VibroGlove An Assistive Technology Aid for Conveying Facial Expressions Sreekar Krishna † , Shantanu Bala, Troy McDaniel, Stephen McGuire &Sethuraman Panchanathan. CUbiC Center for C ognitive Ubi quitous C omputing http://cubic.asu.edu. Motivation.

E N D
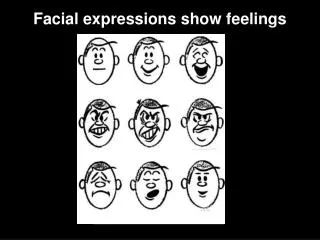
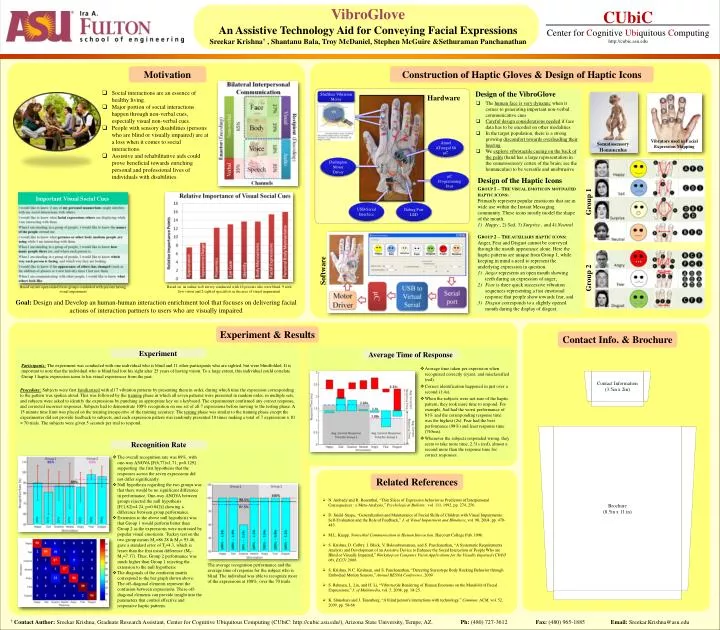
VibroGlove An Assistive Technology Aid for Conveying Facial Expressions Sreekar Krishna† , Shantanu Bala, Troy McDaniel, Stephen McGuire &Sethuraman Panchanathan CUbiCCenter for Cognitive Ubiquitous Computing http://cubic.asu.edu Motivation Construction of Haptic Gloves & Design of Haptic Icons • Social interactions are an essence of healthy living. • Major portion of social interactions happen through non-verbal cues, especially visual non-verbal cues. • People with sensory disabilities (persons who are blind or visually impaired) are at a loss when it comes to social interactions. • Assistive and rehabilitative aids could prove beneficial towards enriching personal and professional lives of individuals with disabilities. Design of the VibroGlove Shaftless Vibration Motor Hardware • The human face is very dynamic when it comes to generating important non-verbal communicative cues • Careful design considerations needed if face data has to be encoded on other modalities • In the target population, there is a strong growing discomfort towards overloading their hearing • We explore vibrotactile cueing on the back of the palm(hand has a large representation in the somatosensory cortex of the brain; see the homunculus) to be versatile and unobtrusive Vibrators used in Facial Expression Mapping Somatosensory Homunculus Atmel ATmega168 μC Darlington Motor Driver Design of the Haptic Icons μC Programming Port Group 1 – The visual emoticon motivated haptic icons: Primarily represent popular emoticons that are in wide use within the Instant Messaging community. These icons mostly model the shape of the mouth. Happy , 2) Sad, 3) Surprise , and 4) Neutral Group 2 – The auxiliary haptic icons: Anger, Fear and Disgust cannot be conveyed through the mouth appearance alone. Here the haptic patterns are unique from Group 1, while keeping in mind a need to represent the underlying expression in question. Angerrepresents an open mouth showing teeth during an expression of anger; Fear is three quick successive vibration sequences representing a fast emotional response that people show towards fear, and Disgust corresponds to a slightly opened mouth during the display of disgust. Important Visual Social Cues Group 1 USB-Serial Interface Debug Port LED Software Group 2 Based on an online web survey conducted with 16 persons who were blind, 9 with low vision and 2 sighted specialists in the area of visual impairment Based on two open ended focus groups conducted with persons having visual impairment Goal: Design and Develop an human-human interaction enrichment tool that focuses on delivering facial actions of interaction partners to users who are visually impaired Experiment & Results Contact Info. & Brochure Experiment Average Time of Response Participants: The experiment was conducted with one individual who is blind and 11 other participants who are sighted, but were blindfolded. It is important to note that the individual who is blind had lost his sight after 25 years of having vision. To a large extent, this individual could correlate Group 1 haptic expression icons to his visual experiences from the past. • Average time taken per expression when recognized correctly (cyan), and misclassified (red). • Correct identification happened in just over a second (1.4s). • When the subjects were not sure of the haptic pattern, they took more time to respond. For example, Sad had the worst performance of 81% and the corresponding response time was the highest (2s). Fear had the best performance (98%) and least response time (765ms). • Whenever the subjects responded wrong, they seem to take more time, 2.31s (red), almost a second more than the response time for correct responses. Contact Information (3.5in x 2in) Procedure: Subjects were first familiarized with all 7 vibration patterns by presenting them in order, during which time the expression corresponding to the pattern was spoken aloud. This was followed by the training phase in which all seven patterns were presented in random order, in multiple sets, and subjects were asked to identify the expressions by punching an appropriate key on a keyboard. The experimenter confirmed any correct response, and corrected incorrect responses. Subjects had to demonstrate 100% recognition on one set of all 7 expressions before moving to the testing phase. A 15 minute time limit was placed on the training irrespective of the training accuracy. The testing phase was similar to the training phase except the experimenter did not provide feedback to subjects, and each expression pattern was randomly presented 10 times making a total of 7 expressions x 10 = 70 trials. The subjects were given 5 seconds per trial to respond. Brochure (8.5in x 11 in) Recognition Rate • The overall recognition rate was 89%, with one-way ANOVA [F(6,77)=1.71, p=0.129] supporting the first hypothesis that the responses across the seven expressions did not differ significantly. • Null hypothesis regarding the two groups was that there would be no significant difference in performance, One-way ANOVA between groups rejected the null hypothesis [F(1,82)=4.24, p=0.042)] showing a difference between group performance. • Extension to the above null hypothesis was that Group 1 would perform better than Group 2 as the expressions were motivated by popular visual emoticons. Tuckey test on the two group means M1=86.28 & M2= 93.46, gave a standard error of Ts=4.3, which is lesser than the first mean difference (M2-M1=7.17). Thus, Group 2 performance was much higher than Group 1 rejecting the extension to the null hypothesis. • The diagonals of the confusion matrix correspond to the bar graph shown above. The off-diagonal elements represent the confusion between expressions. These off-diagonal elements can provide insight into the parameters that control effective and responsive haptic patterns. Related References • N. Ambady and R. Rosenthal, “Thin Slices of Expressive behavior as Predictors of Interpersonal Consequences : a Meta-Analysis,” Psychological Bulletin, vol. 111, 1992, pp. 274, 256. • D. Jindal-Snape, “Generalization and Maintenance of Social Skills of Children with Visual Impairments: Self-Evaluation and the Role of Feedback,” J. of Visual Impairment and Blindness, vol. 98, 2004, pp. 470-483. • M.L. Knapp, Nonverbal Communication in Human Interaction, Harcourt College Pub, 1996. • S. Krishna, D. Colbry, J. Black, V. Balasubramanian, and S. Panchanathan, “A Systematic Requirements Analysis and Development of an Assistive Device to Enhance the Social Interaction of People Who are Blind or Visually Impaired,” Workshop on Computer Vision Applications for the Visually Impaired (CVAVI 08), ECCV 2008. • S. Krishna, N.C. Krishnan, and S. Panchanathan, “Detecting Stereotype Body Rocking Behavior through Embodied Motion Sensors,” Annual RESNA Conference, 2009. • S. Rehman, L. Liu, and H. Li, “Vibrotactile Rendering of Human Emotions on the Manifold of Facial Expressions,” J. of Multimedia, vol. 3, 2008, pp. 18-25. • K. Shinohara and J. Tenenberg, “A blind person's interactions with technology,” Commun. ACM, vol. 52, 2009, pp. 58-66. The average recognition performance and the average time of response for the subject who is blind. The individual was able to recognize most of the expressions at 100%, over the 70 trails. †Contact Author: Sreekar Krishna, Graduate Research Assistant, Center for Cognitive Ubiquitous Computing (CUbiC: http://cubic.asu.edu/), Arizona State University, Tempe, AZ. Ph:(480) 727-3612 Fax:(480) 965-1885 Email:Sreekar.Krishna@asu.edu