Download
1 / 1
10 likes | 126 Vues
Drift from boom sprayers 4. Comparison between direct and indirect drift assessment means. D NUYTTENS 1 , K BAETENS 2 , M DE SCHAMPHELEIRE 3 & B SONCK 1 1 Institute for Agricultural and Fisheries Research (ILVO), Technology & Food, Agricultural Engineering, Belgium

E N D
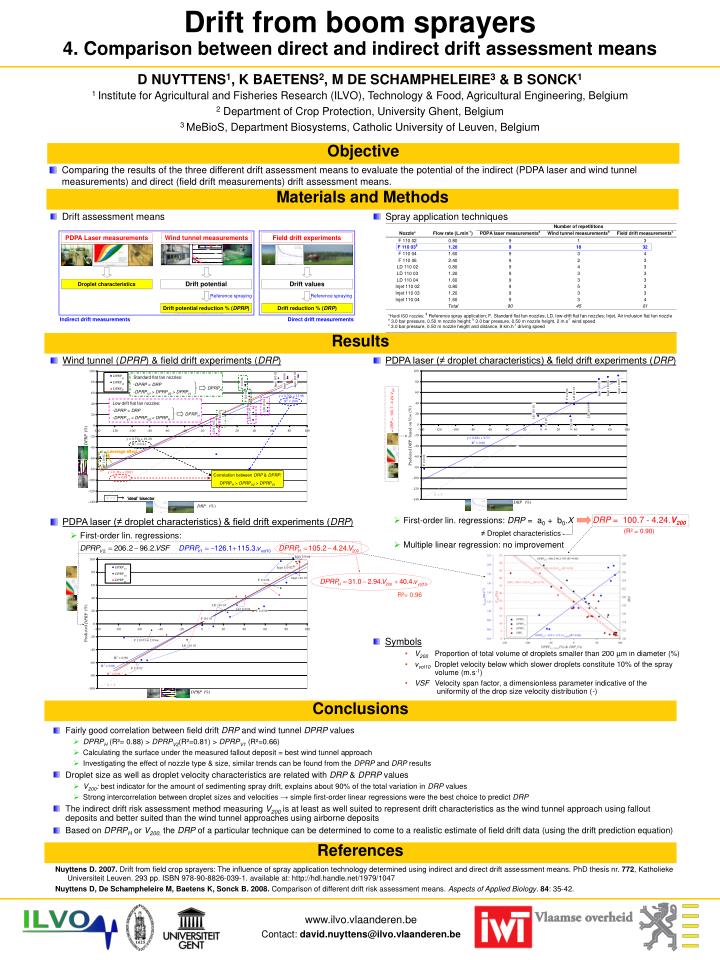
Drift from boom sprayers 4. Comparison between direct and indirect drift assessment means D NUYTTENS1, K BAETENS2, M DE SCHAMPHELEIRE3& B SONCK1 1 Institute for Agricultural and Fisheries Research (ILVO), Technology & Food, Agricultural Engineering, Belgium 2 Department of Crop Protection, University Ghent, Belgium 3 MeBioS, Department Biosystems, Catholic University of Leuven, Belgium Objective Comparing the results of the three different drift assessment means to evaluate the potential of the indirect (PDPA laser and wind tunnel measurements) and direct (field drift measurements) drift assessment means. Materials and Methods Drift assessment means Spray application techniques PDPA Laser measurements Wind tunnel measurements Field drift experiments Droplet characteristics Drift potential Drift values Reference spraying Reference spraying Drift potential reduction %(DPRP) Drift reduction %(DRP) indirect drift measurements Indirect drift measurements Direct drift measurements Results Wind tunnel (DPRP) & field drift experiments (DRP) • PDPA laser (≠ droplet characteristics) & field drift experiments (DRP) + DRP = 100.7 - 4.24.V200 • First-order lin. regressions: DRP = a0 + b0.X • Multiple linear regression: no improvement • PDPA laser (≠ droplet characteristics) & field drift experiments (DRP) • First-order lin. regressions: DRP = 100.7 - 4.24.V200 (R² = 0.90) ≠Droplet characteristics R²= 0.96 • Symbols • V200Proportion of total volume of droplets smaller than 200 µm in diameter (%) • vvol10 Droplet velocity below which slower droplets constitute 10% of the spray volume (m.s-1) • VSF Velocity span factor, a dimensionless parameter indicative of the uniformity of the drop size velocity distribution (-) Conclusions • Fairly good correlation between field drift DRP and wind tunnel DPRP values • DPRPH (R²= 0.88) > DPRPV2(R²=0.81) > DPRPV1 (R²=0.66) • Calculating the surface under the measured fallout deposit = best wind tunnel approach • Investigating the effect of nozzle type & size, similar trends can be found from the DPRP and DRP results • Droplet size as well as droplet velocity characteristics are related with DRP & DPRP values • V200: best indicator for the amount of sedimenting spray drift, explains about 90% of the total variation in DRP values • Strong intercorrelation between droplet sizes and velocities → simple first-order linear regressions were the best choice to predict DRP • The indirect drift risk assessment method measuring V200 is at least as well suited to represent drift characteristics as the wind tunnel approach using fallout deposits and better suited than the wind tunnel approaches using airborne deposits • Based on DPRPH or V200, the DRP of a particular technique can be determined to come to a realistic estimate of field drift data (using the drift prediction equation) References Nuyttens D. 2007. Drift from field crop sprayers: The influence of spray application technology determined using indirect and direct drift assessment means. PhD thesis nr. 772, Katholieke Universiteit Leuven. 293 pp. ISBN 978-90-8826-039-1. available at: http://hdl.handle.net/1979/1047 Nuyttens D, De Schampheleire M, Baetens K, Sonck B. 2008. Comparison of different drift risk assessment means. Aspects of Applied Biology. 84: 35-42.