Download
1 / 15
150 likes | 280 Vues
Matthew Lagor Remote Sensing Stability Indices and Derived Product Imagery from the GOES Sounder 5.8.02. Introduction. GOES Sounder Impact and DPI uses. Atmospheric Stability Products. Limitations of DPI. Questions. GOES Sounder Impact.

E N D
Matthew Lagor Remote Sensing Stability Indices and Derived Product Imagery from the GOES Sounder 5.8.02
Introduction • GOES Sounder Impact and DPI uses • Atmospheric Stability Products • Limitations of DPI • Questions
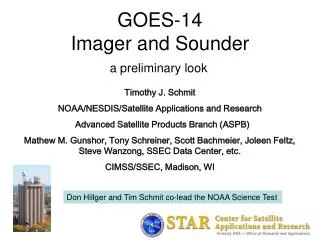
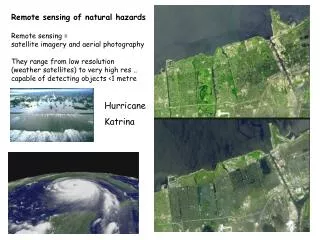
GOES Sounder Impact • GOES Profile retrievals (in absence of clouds), typically have • a separation of 50 km and are determined at 40 pressure levels from • 1000 to .1 hPa. Compared to horizontal resolution of the radiosonde • stations that are roughly 400 km apart. • The radiosonde network launches one balloon every 12 hours. • The GOES Sounder retrieves temperature and moisture profiles • over the entire US and ocean every hour. This corresponds to nearly • 2000-3000 retrievals per hour. • Sounder profiles are assimilated into the numerical prediction • models. • With the GOES Sounder capabilities, forecasters can accurately • monitor and track atmospheric changes on both small and large • scales. As well as improve both nowcasting and forecasting methods.
GOES-8 Sounder Channels • The GOES Sounder has 18 thermal infrared bands as well as a visible channel Wavelength (um), Channel, Purpose Longwave 14.71 1 Stratosphere temperature 14.37 2 Tropopause temperature 14.06 3 Upper-level temperature 13.96 4 Midlevel temperature 13.37 5 Low-level temperature Window 12.66 6 Total PW 12.02 7 Surface temp., moisture 11.03 8 Surface temperature Ozone 9.71 9 Total ozone Water vapor 7.43 10 Low-level moisture 7.02 11 Midlevel moisture 6.51 12 Upper-level moisture Shortwave 4.57 13 Low-level temperature 4.52 14 Midlevel temperature 4.45 15 Upper-level temperature Nitrogen 4.13 16 Boundary-layer temperature Window 3.98 17 Surface temperature 3.74 18 Surface temp., moisture Visible 0.94 Cloud
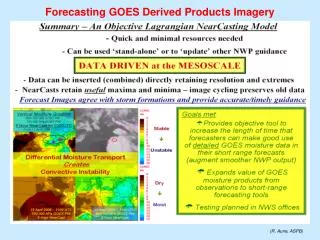
Derived Product Imagery (DPI) • Some of the products include: Total Precipitable Water, • Lifted Index, Cloud Amount, Cloud Top Pressure, • Cloud Top Temperature, Ozone, and Land-Sea Surface • Temperature. • Pseudo Images such as CAPE and CIN can also be derived • from the temperature and moisture profiles. • Sounder derived products were experimentally used by • forecasters dating back to 1996. • Products such as LI, CAPE, and TPW have improved • both real-time nowcasting and forecasting convective • development and severe weather activity. • GOES Sounder retrievals have also been used to forecast the • potential for downbursts
Total Precipitable Water • Precipitable water is the total moisture content in a column of air • condensed into millimeters of water. • Values across the US range from 5 to 55 mm • Calculated by integrating over the retrieved moisture profile • Moisture profile is calculated through the radiance • measurements found in the longwave split windows, the • shortwave window, and the water vapor band. • Used to delineate stable from unstable air masses, rainfall • intensity, dry line location, and low temperatures.
CAPE • The available positive (buoyant) energy a parcel would • obtain ascending from the LFC to the EL. • CAPE is a pseudo DPI product values having been • recreated after the fact in an image format from the • CAPE values. • A moderately unstable air mass would have a CAPE • value close to 1500 J/kg. Typical values of severe • weather CAPE values range from 3000-5000 J/kg.
Lifted Index • The Lifted Index is formed by lifting a boundary layer parcel • to 500 mb and comparing the resultant temperature of the • parcel with the ambient temperature. • LI values are taken directly from the sounding. • Negative values of LI indicate the parcel of air being warmer • than the environment, therefore being indicative of an unstable • environment. • LI values from –4 to –8 degrees C correspond to significant • potential instability. • LI Images can be used to judge areas of potential convective • development and current storm intensities.
GOES Sounder Limitations • Sounder data can only be retrieved in the absence • of clouds. • Timeliness and vertical resolution remain as a source • for improvement • Satellite and radiosonde measurements are not • always concurrent in time or space • Radiosonde data are point measurements, while • satellite derived quantities are volumetric • measurements.