Download
1 / 18
180 likes | 330 Vues
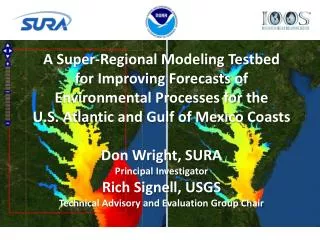
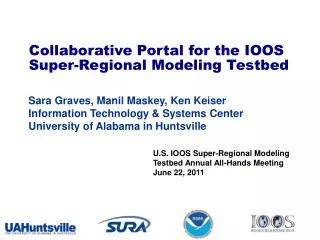
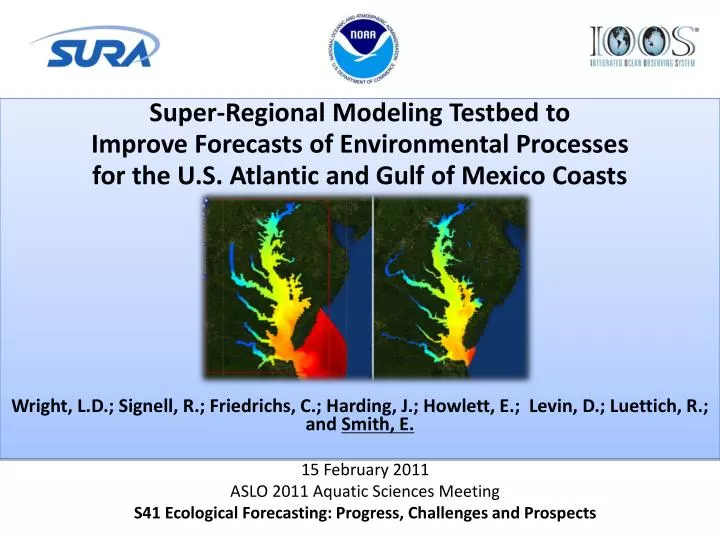
Super-Regional Modeling Testbed to Improve Forecasts of Environmental Processes for the U.S. Atlantic and Gulf of Mexico Coasts Wright, L.D.; Signell, R.; Friedrichs, C.; Harding, J.; Howlett, E.; Levin, D.; Luettich, R.; and Smith, E. 15 February 2011 ASLO 2011 Aquatic Sciences Meeting

E N D
Super-Regional Modeling Testbed to Improve Forecasts of Environmental Processes for the U.S. Atlantic and Gulf of Mexico Coasts Wright, L.D.; Signell, R.; Friedrichs, C.; Harding, J.; Howlett, E.; Levin, D.; Luettich, R.; and Smith, E. 15 February 2011 ASLO 2011 Aquatic Sciences Meeting S41 Ecological Forecasting: Progress, Challenges and Prospects
Outline • Southeastern Universities Research Assn (SURA) • Motivation for the Testbed: Improving prediction of environmental processes • Design of this Testbed • Year 1 Products • Future work
SURA’s Mission:To advance nuclear physics, information technology, and facilitate better understanding of coastal and environmental phenomena that impact our lives.
Outline • Southeastern Universities Research Assn (SURA) • Motivation for the testbed: Improving prediction of environmental processes • Design of this testbed • Year 1 products • Future work
Improving Forecasts of Coastal Environmental Processes • Factors: • open boundary conditions, • surface and river forcing conditions, • enhanced physics, • adjustable parameters, • data assimilation, numerics, amount of data assimilated, • skill of modelers(!), • vertical and horizontal resolution, • coupling to wave and met models. • “Which model is better?” is not the right question. • What factors in the simulation resulted in a better solution? • How much better? • At what cost?
Defining Improvement • To measure improvement for environmental processes, we need to define skill metrics for specific environmental processes and often for specific region: • Inundation ✔ • Hypoxia ✔ • Search and rescue • Deep oil spills • Navigation • Harmful algal blooms • Diver operations • Alternative energy citing • Beach erosion • Regional impact of climate change • -- ALL REQUIRE DIFFERENT SKILL METRICS! • Operational centers will directly benefit from the community’s help in this process – too broad for NOAA and NAVY!
A Common Cyberinfrastructure for Model Data The ocean community needs a common cyberinfrastructure to access, analyze and display data from the different models: each model community currently has their own standards and toolsets. Structured Grids Unstructured Grid 10 nodes 5x5 6x3 Variety of Stretched Vertical Coordinates
Outline • Southeastern Universities Research Assn (SURA) • Motivation for the testbed: improving prediction of environmental processes • Design of this testbed • Year 1 products • Future work
A Testbed Framework for Coastal Ocean Models • Build a common infrastructure to enable access, analysis and visualization of all coastal ocean model data produced by NOAA, NAVY and IOOS • Develop skill metrics and assess models in three different regions and dynamical regimes, to ensure a robust and powerful infrastructure • Identify factors that could be transitioned to operations • Build stronger relationships between academia and operational centers through collaboration
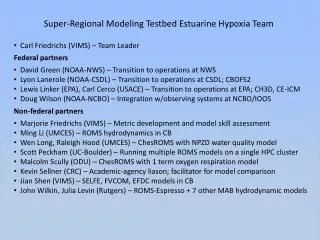
Testbed “Management” 7 members TestbedManagement Testbed Teams TestbedAdvisory/Evaluation Group Cyber Infrastructure Don Wright, Project PI Liz Smith, SURA Doug Levin, Program Mgr Rich Signell, USGS 25 members Estuarine Hypoxia Chesapeake Bay Coastal Inundation Gulf and East Coast Shelf Hypoxia Gulf of Mexico Eoin Howlett, ASA 21 members 20 members 24 members Shelf Hypoxia Gulf of Mexico Shelf Hypoxia Gulf of Mexico Carl Friedrichs, VIMS John Harding, MSU Rick Luettich, UNC-CH
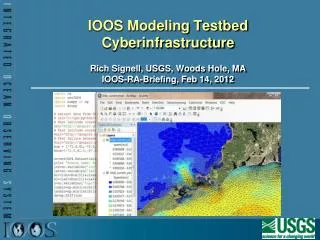
Mapping services and browse application • CyberinfrastructureAll Regions – All Teams • Extending CI from OGC, Unidata and others (NOAA DMIT, USGS CDI) to support unstructured grids, and add functionality • Web Access via OpenDAP w/CF • Unidata Common Data Model/NetCDF Java Library API • Distributed search capability • Browser based map viewer (WMS) • Toolbox for scientific desktop analysis • All components standards-based! Search services Analyze in scientific desktop application
Shelf Hypoxia Gulf of MexicoHydrodynamic & biogeochemical hindcast comparisons of hypoxia models (stand alone) coupled to 3 different Gulf of Mexico hydrodynamics models Evaluation of two shelf hypoxia formulations (NOAA & EPA) ROMS Surface and bottom water oxygen By R. Hetland, K. Fennel and C. Harris mmol O2 m-3
Estuarine Hypoxia Chesapeake Bay 1. Estuary: – 5 Hydrodynamic models – 3 Biological (DO) models – 2004 data from 28 CBP stations – Comparing T, S, max (dS/dz), DO via target diagrams 2. Shelf: OBCs 5 hydrodynamic models Stratification (dS/Dz) Dissolved Oxygen Models doing better on oxygen than stratification! (by M. Friedrichs)
Inundation Extra-tropical – Gulf of MaineTropical – Gulf of Mexico • 4 models: 3 unstructured grid +1 structured grid; • Coupledwave-storm surge-inundation (total water level) • Consistentforcing, validation and skill assessment using existing IMEDS tool, • Extensive observational data sets for historical storms Ike, Rita and Gustav in standard formats, • SURA has provided supercomputer resources. Extratropical Grid for Scituate, MA Tropical Grids for Galveston Bay
Inundation Extra-tropical – Gulf of MaineTropical – Gulf of Mexico- 4 models: 3 unstructured grid +1 structured grid- Coupled wave-storm surge-inundation (TWL)- Consistent forcing, validation and skill assessment using existing IMEDS tool • Extensive observational data sets for historical storms Ike, Rita and Gustav in standard formats • SURA has provided supercomputer resources Interactive Modeling Evaluation and Diagnostic Systems Tropical Grids for Galveston Bay
Testbed Year 1 Products • Foundation of a cyberinfrastructure framework for search, access and display of all NOAA, NAVY and IOOS model data, via browser and scientific desktop application • Skill metrics and identification of key performance factors and cost for three important dynamical regimes and environmental issues • Concept of Operations for transition from research to operations • Improved communication between research and operations
Future Work for the Testbed • Expand to more regions and problems • Examine more factors (e.g. data assimilation) • Build out the cyberinfrastructure • Conduct training in the community • Sustaining future development