Download
1 / 2
20 likes | 159 Vues
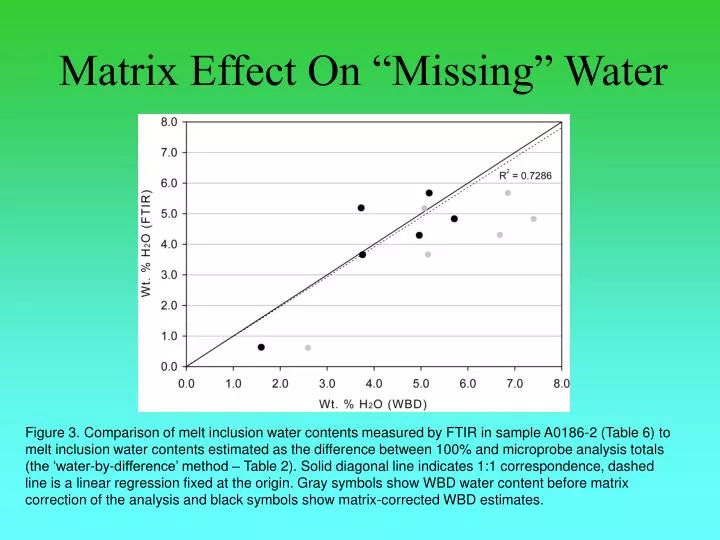
Matrix Effect On “Missing” Water. Figure 3. Comparison of melt inclusion water contents measured by FTIR in sample A0186-2 (Table 6) to melt inclusion water contents estimated as the difference between 100% and microprobe analysis totals

E N D
Matrix Effect On “Missing” Water Figure 3. Comparison of melt inclusion water contents measured by FTIR in sample A0186-2 (Table 6) to melt inclusion water contents estimated as the difference between 100% and microprobe analysis totals (the ‘water-by-difference’ method – Table 2). Solid diagonal line indicates 1:1 correspondence, dashed line is a linear regression fixed at the origin. Gray symbols show WBD water content before matrix correction of the analysis and black symbols show matrix-corrected WBD estimates.