Download
1 / 18
180 likes | 188 Vues
Using qualitative and quantitative stakeholder knowledge and data: Examples from European deepwater fisheries. Pascal Lorance & Verena Trenkel, Ifremer, France Sveinn Agnarsson, University of Iceland Dimitrios Damalas, HCMR, Greece Ivone Figueiredo, IPIMAR, Portugal. Context.

E N D
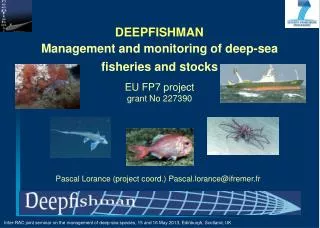
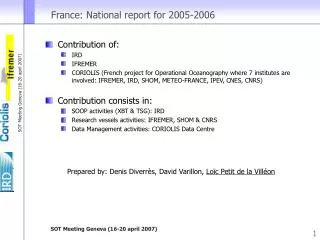
Using qualitative and quantitative stakeholder knowledge and data: Examples fromEuropean deepwater fisheries Pascal Lorance & Verena Trenkel, Ifremer, FranceSveinn Agnarsson, University of Iceland Dimitrios Damalas, HCMR, Greece Ivone Figueiredo, IPIMAR, Portugal Fishery Dependent Information (FDI) conference, Galway, 23-26 August 2010
Context • Deepwater fisheries: • - Data poor • - Stocks can only sustain low exploitation rates • - Fishery management recent in most areas • (EU waters: TACs & access regime from 2003) • - Concerns about fisheries sustainability at stock and ecosystem levels • - Forthcoming revision of the Common Fisheries Policy and EU access regulation for deep-water fisheries Fishery Dependent Information (FDI) conference, Galway, 23-26 August 2010
Stakeholder meetings - Identify deep-water fisheries stakeholders - SWOT (Strengths Weaknesses Opportunities and Threats) of management regimes - Cognitive maps of the fisheries situation and issues Questionnaires on economy and management Haul by haul data Identify management issues and suitable management measures Improve stock assessments Stakeholder knowledge and data Fishery Dependent Information (FDI) conference, Galway, 23-26 August 2010
Cognitive map: example Environmental policy Direction of links positive negative unknown 3c Air quality 1c Time frame a: within 1 yr b: 2-5 yrs c: more than 5 yrs Car prices 3a 2b +/- Strength of links 1: low 2: medium 3: strong Car sales Fishery Dependent Information (FDI) conference, Galway, 23-26 August 2010
Cognitive maps ofmanagement measures and fisheries systems • 7 maps drawn during a workshop Fishery Dependent Information (FDI) conference, Galway, 23-26 August 2010
Black scabbardfish Madeira - Administration Same measures for all Administration Madeira Fishery Dependent Information (FDI) conference, Galway, 23-26 August 2010
Greenland Halibut NAFO Fishery Dependent Information (FDI) conference, Galway, 23-26 August 2010
Black scabbardfishMadeira - local factors - Greenland halibutNAFO - global factors - Socio-economy Fishery Dependent Information (FDI) conference, Galway, 23-26 August 2010
Issues and solutions derived from cognitive maps Levers: variables influencing positively or negatively fisheries that can be modified by management Fishery Dependent Information (FDI) conference, Galway, 23-26 August 2010
Questionnaire Web-based (http://deepfishman.hafro.is) Distributed during one RAC meeting and at regional level 9 questions + free text 22 responses from 3 deep-water fisheries Q3: How do you see the future of deep-sea fisheries? Do they hold a better future, worse, or more or less the same as now? Better (will attract more investors) (3/22) Worse (not viable) (8/22) More or less the same (viable) (10/22) • Stakeholders’ perception: • Not viable fishery for red seabream in Greece • Two other fisheries perceived viable Fishery Dependent Information (FDI) conference, Galway, 23-26 August 2010
Q4: Which of the following management tools would you like to see changed? All dissatisfied Current management not satisfying TACs, spatio-temporal closures and licensing most cited Diversity of responses Fishery Dependent Information (FDI) conference, Galway, 23-26 August 2010
Q5: Which of the following management tools are best suited to protect the deep-water ecosystem? Five management tools favoured TACs understood as stock management tools, not ecosystem-based Fishery Dependent Information (FDI) conference, Galway, 23-26 August 2010
STAKEHOLDER DEPENDENT INFORMATION (tallybooks) Improving stock assessment • Deep-water fisheries generally data-poor • Lack of abundance indices • Data for age structured assessment model missing, unreliable or inappropriate • Stock assessment mostly exploratory (at least in the ICES context) Fishery Dependent Information (FDI) conference, Galway, 23-26 August 2010
Study fisheryDeep-water trawling in ICES Vb, VI and VII Standardised LPUE indices from tallybooks provided by the French fishing industry Fishery Dependent Information (FDI) conference, Galway, 23-26 August 2010
Standardised LPUE indices GAM Model: LPUE = vessel + depth + rectangle + month + year:area effect Lorance, P., Pawlowski, L., Trenkel, V. M. (2010). Standardizing blue ling landings per unit effort from industry aul-by-haul data using generalized additive models. (ICES Journal of Marine Science) doi:10.1093/icesjms/fsq048 Fishery Dependent Information (FDI) conference, Galway, 23-26 August 2010
Conclusions Qualitative information and opinions - Cognitive maps: Perception of the system - Questionnaire: Stakeholder preferred management options Quantitative data - haul by haul data Improved abundance indices Perspectives • Qualitative information and opinions • Cognitive maps/questionnaires: propose appropriate management strategy at fishery/regional level • CFP reform & access regulation revision • Quantitative data • Record haul-by-haul data including depth for some fisheries • Adapt electronic logbook Fishery Dependent Information (FDI) conference, Galway, 23-26 August 2010
Acknowledgements • Thanks to stakeholders contributing to workshops and responding to the questionnaire • Work carried out under the EU funded project DEEPFISHMAN grant agreement 227390 http://deepfishman.hafro.is/ Fishery Dependent Information (FDI) conference, Galway, 23-26 August 2010
Analysing the maps • Grouping the variables chosen by stakeholders into categories • Numbers of variables: 9 to 22 • Number of categories: 4 to 8 • Number of connections: 18 to 41 • Calculation of • Density of connections: 0.08 to 0.25 • Average strength: medium to high • Average time frame: medium to long-term Stock and management measures had strong impact on fisheries, ecosystem, stakeholders and fishery had lowest impact Fishery Dependent Information (FDI) conference, Galway, 23-26 August 2010