Download
1 / 62
620 likes | 724 Vues
QTL ANALYSIS FOR YIELD AND OTHER AGRONOMIC TRAITS IN BARLEY. INTRODUCTION. Production Statistics, Economics and Markets

E N D
Production Statistics, Economics and Markets Barley ranks fourth among the cereals in terms of total world production. The average production is around 136 million metric tonnes. The map below shows the distribution of production by country. Source: FAOSTAT http://oregonstate.edu/instruct/css/330/five
Barley (Hordum vulgare L.), the oldest among cereals, is an autogamous diploid (2n=14) with an average genome size of ~5000 Mbp. It stands fourth among cereals as far as nutritive value and area under cultivation are concerned, but it is in first standing with regard to easily getting adapted and being cultivable in varied climatic conditions as well as the extent to which it is cultivated. Barley, with an area under cultivation of 1.5 million hectares and 2.5 million tons of grain yields is cultivated in most provincial areas in Iran
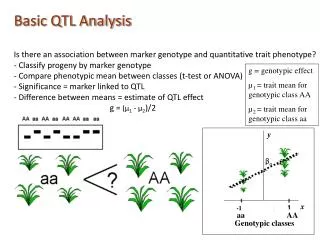
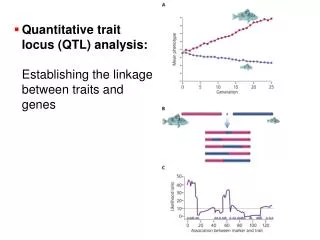
Determination of genes controlling quantitative traits (QTL), such as yield and yield components is of paramount importance to plant breeders. QTL can help breeders to be aware of genetic control of quantitative traits and to improve such traits through an implementation of more efficacious selections. Mapping of quantitative traits controlling genes (QTLs) in a plant is carried out by use of suitable genetic population (AILs, BC, RIL, DH, F3, F2) in which there exists enough diversity for different traits.
QTL analysis can answer a variety of questions including: • How many zones in a genome control a quantitative trait? • Are all these zones equally effective? • Is the effect of some zones more and some others less? • How are the QTLs distributed throughout the genome? • Are they distributed throughout the whole genome or are they concentrated in a particular zone in the genome?
Different markers such as isozymes, SSR, AFLP, RAPD and others are employed in such research activities. • To locate QTLs in a genome after their recognition, there would be a need for a genetic map (a base map). • Nowadays such maps have been prepared for many crop plants including barley. These maps get more and more saturated and more accurate with more research works. In preparation of these maps land marking markers such as RFLP are used. • For determination of QTLs and their locations, different traits are measured in a given population to ascertain the existance of sufficient diversity for the traits measured. Then through the use of molecular markers the genome of the genotypes are being searched to obtain a saturated map. Using this map, then the markers linked to QTLs are being designated. In this way and by the help of the base map the location of QTLs in genome are detected. There are different methods of searching a genome for QTLs, such as regression and methods of maximum likelihood. There has been different softwares such as MULTIQTL, JOINMAP, Mapmaker QTL, etc. designed for this purpose.
This study was carried out to identify genes controlling QTLs related to agronomic traits as well as genes controlling traits related to drought tolerance and also to find the effect of drought stress on yield and yield components in barley.
Summary of the QTLs detected from previous studies using the Steptoe Morex
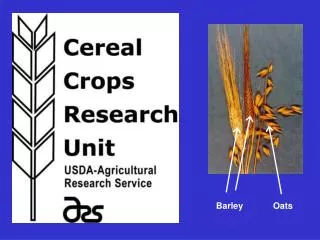
Seeds from 72 doubled haploid (DH) lines of barley, the result of a cross between: Variety Steptoe (six rowed, high yielding, drought susceptible, highly dormant, susceptible to leaf stripe bacterial disease, used as forage) and variety Morex (six rowed, drought resistant, high quality malt and amylase, low dormancy and resistant to leaf stripe bacterial disease), received from University of Tulose, France, were vase planted in a greenhouse in autumn 2000. A sufficient number of seeds were obtained from the cross. The resulting seeds were planted in a randomized complete block design with three replications in the agricultural research farm of University of Tehran in the crop years 2001-2002 and 2002-2003. The planting dates were Nov. 14 and Oct. 28, respectively. A number of 40 seeds were planted in 2-m rows. Rows were 25cm apart. The experimental land was irrigated immediately after cultivation. To test the effect of drought tolerance (as compared to normal irrigation) on yield and yield components and also to identify the genes that control the traits related to drought tolerance, the 1st and 2nd replications were irrigated once more at spike initiation, while the 3rd replication was irrigated for 5 more times as practiced locally. Precipitation amounted to 229 and 221 mm (from planting to harvest date) for the two crop years, respectively.
Traits studied were: • X1: date of flowering (days) • X2: date of spike initiation (days) • X3: date of maturity (days) • X4: plant height (cm) • X5: spike length (mm) • X6: tiller per plant • X7: seed per spike • X8: 1000-seed weight (gr) • X9: protein percentage (%) • y: seed yield (gr)
Where: is the variance component of genotype year and n stands for the number of environments. Additive variance and enviromental variance (Mse) were also determined. Diversity and genetic gain (GG= best DH-best P) for each trait were also determined. A multiple linear regression model was selected to describe the traits with highest effects on variability. Heritability was calculated on the basis of mean of two- year data by use of the formula;
Values obtained for each trait, for the irrigated replication and mean of the two stressed replications, were compared with t-test for each year as well as for the two year means. Analysis of variance was employed to test the effect of year and the effect of stress/year for all traits. • Genetic map of the population under study consisted of 327 RFLP markers with the mean distance of 3.75 cM between any two markers (NABGMP)*. • Considering field measurement results and markers information obtained from 72 DH lines a new map was constructed using 'Grain Genes' information of 150 doubled haploid lines. Then QTL analysis was performed for each trait and each chromosome in each year; and a combination of the above information was employed to determine the interaction of genotype environment (year and drought stress). Analysis of QTLs was performed on the basis of the average for the two years, using MULTI QTL software. Significant QTL effects (P= 0.027) with the LOD value of 2.33 for a nonsaturated map of studied traits was considered. Significant LODs were found by permutation test using MULTI QTL software. • LOD peaks with the probability of 95% were considered as the most probable QTL effects. Confidence intervals were assessed through 1000- time bootstrap replicated samplings, using MULTI QTL software. * North American Barley Genome Mapping Project
Genetic map of barley Steptoe Morex from Anderis Kleinhofs, updated 1/94 from the map referenced. Reference : A. Kleinhofs et al. 1993. A molecular, isozyme and morphological map of the barley (Hordeum vulgare L.) genome, Theor.Appl.Genet. 86 : 705-712 Map position in (cM)Kosambi
Markers distribution in the linkage groups map of Steptoe × Morex in 150 barley doubled haploid lines
Phenotypic correlation coeffietients between quantitative traits in barley doubled haploid lines
Diversity, genetic gain and heitability for agronomic traits in 72 barley DHs and their parents ns=non-significant A= mean DHs B= best parent C= genetic gain (compar. Best DH with best parent) D= genetic gain (compare. 10% best DHs with best parent) E= least sig. diff. F= heritability (from mean of two years using 2 GXE
T-values for comparisons between traits in irrigated(I) and non-irrogated(NI) replications
ANOVA results for traits under study with respect to year and stress(drought) ns,*,**,*** non- significant, significant at 0.05, 0.01 and 0.001, respectively
Locaions and effects of QTLs found for agronomic traits in 72 barley DH lines and their parents(Mean of 2 years) + According to Kosambi mapping (cM) ++ Proportion explained variance (r2)
Locaions and effects of QTLs found for 10 agronomic traits in 72 barley DH lines and their parents (in 2 years) + According to Cosambi mapping (cM) ++ Proportion explained variance (r2)