Download
1 / 39
390 likes | 592 Vues
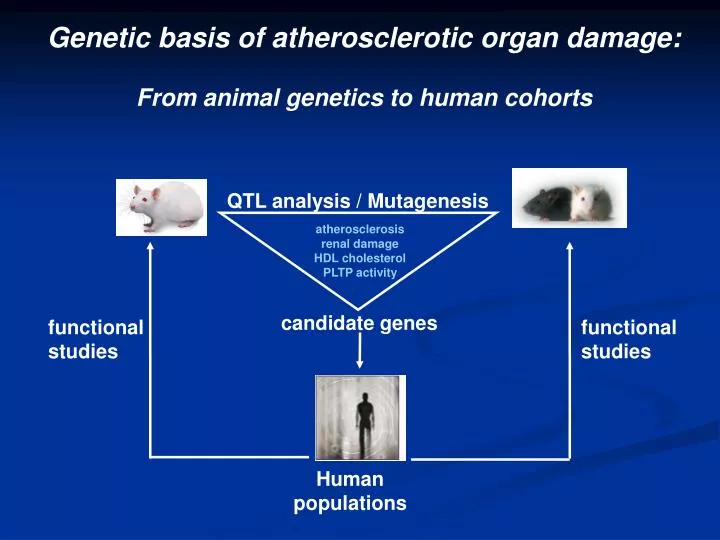
Genetic basis of atherosclerotic organ damage: From animal genetics to human cohorts. QTL analysis / Mutagenesis. atherosclerosis renal damage HDL cholesterol PLTP activity. candidate genes. functional studies. functional studies. Human populations. Principle of QTL analysis (1).

E N D
Genetic basis of atherosclerotic organ damage: From animal genetics to human cohorts QTL analysis / Mutagenesis atherosclerosis renal damage HDL cholesterol PLTP activity candidate genes functional studies functional studies Human populations
Principle of QTL analysis (1) Definitions A quantitative trait is one that has measurable phenotypic variation owing to genetic and/or environmental influences. A QTL is a genetic locus, the alleles of which affect this variation. QTL analysis is a statistical method to map these loci in the species under investigation Members of the Complex Trait Consortium (2003) Nature Reviews Genetics 4:911-916
Advantages of QTL analysis QTL analysis allows identification of novel genes involved in the phenotype. QTL mapping is more likely to find mutations in rate limiting or regulatory genes, which will be very important therapeutic targets.
Comparison between species as a search strategy (1):Concordance of HDL QTL between human and mouse
1 2 3 4 5 6 7 p p p p p p 0 0 0 0 0 0 1 1 1 1 1 1 1 10 10 10 10 10 10 10 20 2 20 2 20 2 20 2 20 2 20 2 20 2 30 3 30 3 30 3 30 3 30 3 30 3 30 3 4 4 4 4 4 4 4 40 40 40 40 40 40 40 Ath8 Ath3 Artles 5 5 5 5 5 50 50 50 50 50 50 50 6 6 6 6 6 6 60 60 60 60 60 60 60 Athsq2 70 7 70 7 70 7 70 Athsq1 70 7 70 7 70 7 74 d 75 d 8 80 8 80 8 80 8 80 80 8 d 84 90 9 9 9 90 90 90 Ath1 d 92 d 95 Ath9 10 10 100 100 110 11 114 d 120 12 15 16 17 18 19 8 9 10 11 12 13 14 atherogenic diet Apoe or Ldlr KO human concordance rabbit concordance p p p p p 0 0 0 0 0 p p p p p 0 p p 0 0 0 0 0 0 Ath6 Ath11 1 1 1 1 1 10 10 10 10 10 1 1 1 1 1 1 1 10 10 10 10 10 10 10 Ath18 2 2 2 2 2 20 20 20 20 20 20 2 20 20 2 20 2 20 2 20 2 20 2 Ath20 3 3 3 3 3 Ath13 30 30 30 30 30 Ath16 30 3 30 3 30 3 30 3 30 3 30 3 30 3 Ath17 Ath7 4 4 4 4 4 40 40 40 40 40 4 4 4 4 4 4 40 40 40 40 40 40 40 5 5 5 5 5 50 50 50 50 50 5 5 5 5 5 5 5 50 50 50 50 50 50 50 d 56 6 6 6 d 60 60 60 60 6 6 6 6 6 6 6 60 60 60 60 60 60 60 Ath19 7 70 7 7 70 70 d 66 d 72 69 d 70 7 70 7 70 7 70 7 70 7 8 80 8 80 d 77 d 81 d 82 8 d 80 79 80 d 80 d d 82 Comparison between species as a search strategy (2):Concordance of atherosclerosis QTL between human and mouse
Locating Ath8, a locus for murine atherosclerosis susceptibility and testing several of its candidate genes in mice and humans. Korstanje R, Eriksson P, Samnegard A, Olsson, Forsman-Semb K, Sen S, Churchill G, Rollins J, Harris S, Hamsten A, Paigen B Atherosclerosis, 2004, 177:443-450 1. QTL for atherosclerosis susceptibility was identified in mouse 2. Candidate genes were tested 3. Gene was identified with likely functional difference 4. Association was found between human homolog and cohort
SM/J NZB/B1NJ X F1 F2 258 females
Angptl3 polymorphisms between NZB and SM mice. abasepair numbering based on Genbank No. XM_131498. bamino acid numbering based upon the first ATG as +1.
ANGPTL3 genotype distribution in patients and controls. Controls Patients P ANGPTL3_1 AA 153 171 A/G 183 143 G/G 39 48 <0.05 ANGPTL3_2 G/G 152 170 G/A 183 138 A/A 39 59 <0.01 Age (years) 53.0±4.8 52.3±5.6 NS Sex (men/women) 307/66 304/63 NS BMI (kg/m2) 26.5±11.9 27.4±4.0 NS Plasma triglycerides (mmol/L) 1.37±0.74 1.95±1.21 <0.0001 LDL cholesterol (mmol/L) 3.50±0.88 3.23±0.99 <0.0001 HDL cholesterol (mmol/L) 1.39±0.41 1.10±0.30 <0.0001 Plasma insulin (pmol/L) 42.05±23.67 57.13±40.49 <0.0001 Plasma proinsulin (pmol/L) 4.48±3.48 7.21±7.69 <0.0001 Numbers of genotypes are shown for the two polymorphisms. Continuous values are means±SD
ANGPTL3 genotypes and severity of angiographically determined coronary artery disease in postinfarction patients. Values are shown as means±SD. awhen adjusted for plasma triglyceride concentration. BMI, body mass index; LDL, low density lipoprotein; HDL, high density lipoprotein, insulin, proinsulin and smoking.
Conclusions (part 1) Animal models (rat and mouse in particular) can make identifying candidate genes easier because of less genetic complexity, better genetic tools, and a controlled environment Concordance between mouse, rat, and human QTL allow the use of animal models for candidate gene selection.
Haplotypes Haplotype structure of 1,450 diallelic variants with SDP frequency >1% between eight inbred strains (A/J, AKR, BALB/c, C3H, C57BL/6, DBA/2, I, and RIII)across a 4.8-Mb region of mouse chromosome 1 Yalcin, B. et al. (2004) Proc. Natl. Acad. Sci. USA 101, 9734-9739
In silico mapping (1) Pletcher et al: 48 inbred strains, 10.990 SNPs Presence or absence of the retinal degeneration and albino phenotypes was given a numerical value of 1 or 0 for use in the mapping algorithm. The most significant P value was obtained for the region that contains the gene known to produce these phenotypes.
In silico mapping (2) Comparison of in silico QTL with experimentally derived QTL
In silico mapping (3) Analysis of Adcy7 haplotypes reveals amino acid associated with HDL phenotypes
Kidney disease QTL are concordant in rat, human, and mouse Korstanje and DiPetrillo, AJP Renal, 287:F347-F352
Promising regions for renal damage are our current focus Korstanje and DiPetrillo, AJP Renal, 287:F347-F352
Analysis of QTL studies and haplotypes RNO9 0 D9Rat29 D9Rat26 50 D9Mit3 D9Rat64 100 D9Rat3 D9Mco6 SSxSHR 8 wk males Mehr et al UAE16 LOD 8.0 SSxSHR 16 wk males Garrett et al UAE25 LOD 3.5 MWFxSHR 14 wk males Schulz et al NO QTL MWFxLew 14 wk males/females Schulz et al
Haplotype analysis narrows QTL intervaland excludes many genes
Test candidate genes for sequence and expression differences between strains Lewis MWF MWF 16 wks SHR Dahl SS Lewis 16 wks MWF 16 wks Dahl SS 16 wks Lewis 8 wks SHR 16 wks Dahl SS 8 wks SHR 8 wks
Quantifying Complex Traits: Epidemiology of Phenotype-Genoype Interactions Mike W. Zuurman
F F P P Complex Traits Diagram P + + P = trait = intermediate phenotype 9 Environment P 6 1 P EF 3 EF 5 2 G EF P EF 7 4 G G 10 Individual 1. env. response to phenotype (treatment), 2. env. influence on gene expression, 3. env. inducing internal phenotype, 4. env. influencing expression of unknown gene, 5. phenotypes combine to one detectable phenotype, 6. phenotype is only partly surfacing, 7. internal feedback mechanisms 8. unidentified gene influencing detectable phenotype, 9. un- visible/detectable/known phenotype 10. gene-phenotype-phenotype-gene interaction
Complex Traits Example: Cholesterol Metabolism Genetic Complex Traits End organ damage
Some end-points of interest in the clinic • Hypertension • Ischemia • Infarction • Diminished/Elevated filtration • Albuminuria • Mortality • Immunological abnormalities • Metabolic Syndrome • Other lipid-related phenotypes • Etc.
Age Confounders • associated with exposure • related to the outcome • -not part of the causal pathway • Mother highly educated Child Down syndrome • Alcohol intake Lung cancer • Blood pressure UAE Smoking Gender
CETP Taq 1B single nucleotide polymorphism B1/B1 B1/B2 B2/B2 Linear regression (HDL) Means B1B1 B1B2 B2B2 PREVEND-data
complexity Clinical relevance Logistic regression Significant effect on clinical intermediate phenotype Borderline effect on clinical phenotype Borderline effect on clinical end point
Complexity and novel tools Complex Traits : 2 or more genotypes confound phenotype Visualization of complexity Conceptual thinking: Given a parameter measured in a population one is able to detectdifferences in frequency of a combination of geno- or phenotypesalong the range of the parameter when compared to the prevalanceof that combination in the whole population.
Visualization of complexity y f1a a f2a f3a f4a f1b b f2b f3b f4b f1c f2c f3c f4c c d f1d f2d f3d f4d HDL-c f1e e f2e f3e f4e Frequency of combination n Frequency of combination 1 Frequency of combination 2 Frequency of combination 3 f f1f f2f f3f f4f g f1g f2g f3g f4g h f1h f2h f3h f4h 0 0 combinations combinations
PREVEND-data Example 1: Hypothesis driven visualization Phenotype : HDL-cholesterolComplex Trait: CETP-Taq1B + CETP-I405V Chi-square Test B1B2II B1B2VV B1B1II FGClustor 1.0, XeNTaX
PREVEND-data Phenotype : Metabolic syndrome Complex Trait: Gender + Quintile Age + CETP-Taq1B + CETP-I405V B1B2IV B1B2II B1B1II females in the highest quintile of age FGClustor 1.0, XeNTaX
PREVEND-data Phenotype : Mortality Complex Trait: Gender + Quintile Age + CETP-Taq1B + CETP-I405V B1B2IV B1B2II B1B1II B1B1IV males in the highest quintile of age FGClustor 1.0, XeNTaX
Standard statistics and novel visualization of complexity combined to generate the following working theory: In the general population, the CETP B1 and I allele, known to lead to lower HDL levels and less CETP activity, are associated with metabolic syndrome and higher mortality in the elderly.
PREVEND-data Example 2 – Strong confounders Phenotype: Systolic blood pressureComplex Trait: Quartiles Cholesterol + Gender Chi-square Test M1 M2 M3 M4 F2 F3 F4 F1 FGClustor 1.0, XeNTaX
PREVEND-data Example 3: Non-hypothesis driven “Phenotype” : Age Complex Trait : 5 Renin-aldosteron-angiotensin System genotypes Chi-square Test No low p values Increasingly complex system requires huge sample size besides solid hypothesis
F P 9 P 6 1 P EF 3 EF 5 2 G EF P EF 7 4 G G 10 Concluding remarks on the epidemiology of Breedtestrategie • Powerful statistical methods help uncover “mild”complex genetical pathways leading to clinically relevant phenotypes. • Yet, increasing complexity of the trait shows limitations of standard epidemiological statistics when applied on current population sizes; • Development of novel tools help identify undocumented traits of greater complexity • Interdisciplinary communication and exchange of expertise in dealing with complex traits will boost research
http://www.ctcg.org Complex Trait Centre Groningen (CTCG) • CTCG is an interdisciplinary community of researchers that deal with genetic traits in the broad sense of the word • CTCG will organize seminars by people in the field that will educate researchers in their approach • – join the mailinglist to receive emails informing of upcoming events! • - propose speakers for seminars at info@ctcg.org! • CTCG aims at communicating problem solving in the daily routine of complex trait research • CTCG is cooperative and not restricted to set departments • CTCG invites anyone that is interested in complex trait research to join the CTCG community