Download
1 / 19
190 likes | 338 Vues
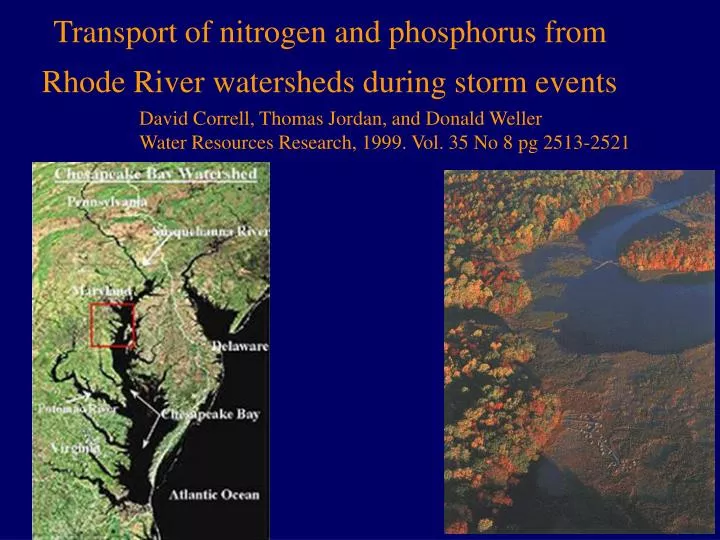
Transport of nitrogen and phosphorus from Rhode River watersheds during storm events. David Correll, Thomas Jordan, and Donald Weller Water Resources Research, 1999. Vol. 35 No 8 pg 2513-2521. Why this paper?. One of many papers from the SERC on the Rhode River Watershed since the 1970s

E N D
Transport of nitrogen and phosphorus from Rhode River watersheds during storm events David Correll, Thomas Jordan, and Donald WellerWater Resources Research, 1999. Vol. 35 No 8 pg 2513-2521
Why this paper? • One of many papers from the SERC on the Rhode River Watershed since the 1970s • Effects of land use, season, and storm characteristics on nutrient transport
Site Description Land Use effects: 4 watersheds Watershed 101 Mixed Use Land Use Watershed 109 Crops Watershed 110 Forest Watershed 111 Grazed Forest Row crops Pasture and Hay fields Residential Old Fields
Chemistry • Phosphorus • PPi, Dpi, POP, DOP • Nitrogen • NO3-, NH4, PON, DON • Continuous baseflow samples and storm samples • Collected and returned w/in 24 hr • Filtered 0.45 m
Discharge 120° and 150 ° V notch weirs Stilling wells, floats every 5 minutes
Loads: Linear interpolation • Steps: • Connect the concentrations using a linear interpolation • Integrate the instantaneous load for the period between the first sample and the last using equation (1) (1)
Base flow vs. Storm Storm Particulate + Dissolved Fractions added
Seasonal P Comparison WS 101: Mixed LU WS 109: Cropland LU
Seasonal N Comparison WS 101: Mixed LU WS 109: Cropland LU Summer: Particulates
N/P Relationships Mainly due to increases in Particulate P
Discussion Particulate nutrients related to soil, soil erosion.
Discussion Peak water discharge correlated to mean particulate nutrient concentrations • Eliminating need to know rainfall volume or intensity • Smaller 1st order catchments • Shorter, more intense storm discharges [NH4] increased with peak water discharge - slopes much lower
Sampling implications 1 large summer storm 24% of TP for entire summer 18% of TPi for entire summer 30% of TOP for entire spring 18.5% of TON for entire spring 1 large spring storm 39% of TP for entire spring 41% of TPi for entire spring 38% of TOP for entire spring 12% of of TON for entire spring Discussion
Questions????? • Why do storms increase particulate nutrient concentrations but do not influence dissolved concentrations? • If sediment related, why isn’t rain (detachment) as important as flow? • Implications for sampling: every storm? Or use different load estimation? • Internal validity- are differences really seasonal and land use related • External validity? – how is this applicable to other watersheds