Download
1 / 14
140 likes | 374 Vues
Aim: How do we apply the characteristics of normal distribution?. 10 coins tossed 100 times result in the following table. Draw a histogram based on the table and determine the mean, x. 1. 3. 5. 7. 9. Do Now:. Normal Curve – the ‘Bell Curve’. also mode & median. symmetrical.

E N D
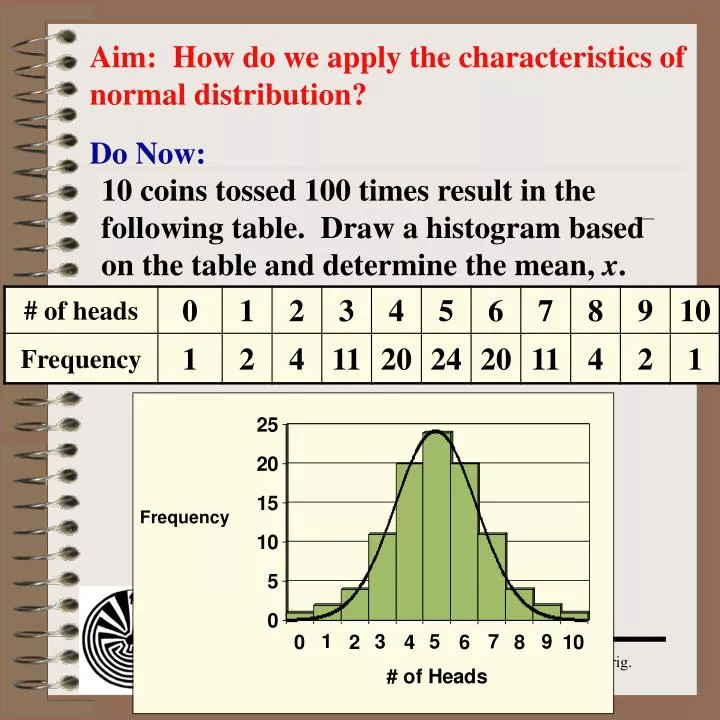
Aim: How do we apply the characteristics of normal distribution? 10 coins tossed 100 times result in the following table. Draw a histogram based on the table and determine the mean, x. 1 3 5 7 9 Do Now:
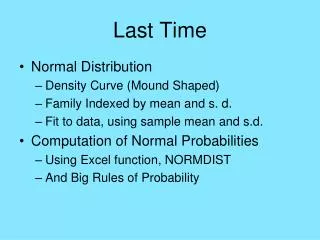
Normal Curve – the ‘Bell Curve’ also mode & median symmetrical The most prominent probability distribution in statistics.
99.5% of data values 95% of data values 68% of data values 13.5% 13.5% Normal Distribution 34% 34% 68% of data lie within 1 standard deviation of mean. 95% of data within 2 standard deviations of mean. 99.5% of data within 3 standard deviations of mean.
99.5% of data values 95% of data values 68% of data values Percentile 13.5% 34% 34% 13.5% 2.5 16 50 84 97.5 percentile of a score or a measure indicates what percent of the total frequency scored at or below that measure.
128 133 143 148 Model Problem • In a normal distribution, the mean height of 10-year-old children is 138 centimeters and the standard deviation is 5 centimeters. Find the heights that are • exactly one standard deviation above and below the mean • two standard deviations above and below the mean • In a normal distribution, the mean height of 10-year-old children is 138 centimeters and the standard deviation is 5 centimeters. Find the heights that are • exactly one standard deviation above and below the mean • two standard deviations above and below the mean
68% 95% 10-year-old Model Problem In a normal distribution, the mean height of 10-year-old children is 138 centimeters and the standard deviation is 5 centimeters. 13.5% 13.5% 34% 34% 128 133 143 148 2.5 16 50 84 97.5 Of the children: 68% are between 133 and 143 centimeters tall 95% are between 128 and 148 centimeters tall 34% are between 138 and 142 centimeters tall
13.5% 34% 34% 13.5% 10-year-old Model Problem In a normal distribution, the mean height of 10-year-old children is 138 centimeters and the standard deviation is 5 centimeters. 128 133 143 148 2.5 16 50 84 97.5 A ten-year-old who is 133 cm. tall is at the 16th percentile; 16% are shorter, 84% taller Heights that would occur less than 5% of the time: heights of less than 128 cm. or more than 148 cm.
2pt. Regents Question Assume that the ages of first-year college students are normally distributed with a mean of 19 years and standard deviation of 1 year. To the nearest integer, find the percentage of first-year college students who are between the ages of 18 years and 20 years inclusive. To the nearest integer, find the percentage of first-year college students who are 20 years or older.
13.5% 34% 34% 13.5% 34 43 61 70 2.5 16 50 84 97.5 Model Problem • Scores on the Preliminary Scholastic Aptitude Test (PSAT) range from 20 to 80. For a certain population of students, the mean is 52 and the standard deviation is 9. • A score at the 65th percentile might be • 49 2) 56 3) 64 4) 65 • Which of the following scores can be expected to occur less than 3% of the time? • 39 2) 47 3) 65 4) 71
13.5% 34% 34% 13.5% 12 40 2.5 16 50 84 97.5 Model Problem In the diagram, the shaded area represents approximately 68% of the scores in a normal distribution. If the scores range from 12 to 40 in this interval, find the standard deviation.
4pt. Regents Question Twenty high school students took an examination and received the following scores: 70, 60, 75, 68, 85, 86, 78, 72, 82, 88, 88, 73, 74, 79, 86, 82, 90, 92, 93, 73 Determine what percent of the student scored within one standard deviation of the mean. Do the results of the examination approximate a normal distribution? Justify your answer.
Model Problem In 2000, over 1.2 million students across the country took college entrance exams. The average score on the verbal section showed no improvement over the average scores of the previous 4 years. The average score on the mathematics section was 3 points higher than the previous year’s average. What is the probability that a student’s verbal score is from 401 to 514?
Model Problem In 2000, over 1.2 million students across the country took college entrance exams. The average score on the verbal section showed no improvement over the average scores of the previous 4 years. The average score on the mathematics section was 3 points higher than the previous year’s average. What is the probability that a student’s math score is greater than 727?
Model Problem In 2000, over 1.2 million students across the country took college entrance exams. The average score on the verbal section showed no improvement over the average scores of the previous 4 years. The average score on the mathematics section was 3 points higher than the previous year’s average. Both Susanna’s math and verbal scores were more than one standard deviation above the mean, but less than 2 standard deviations above the mean. What are the lower and upper limits of Susanna’s combined score?