Download
1 / 1
20 likes | 204 Vues
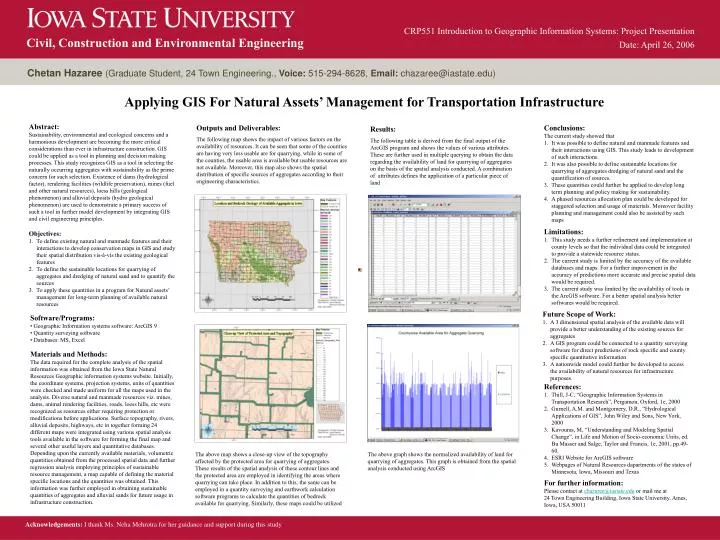
CRP551 Introduction to Geographic Information Systems: Project Presentation Date: April 26, 2006. Civil, Construction and Environmental Engineering. Chetan Hazaree (Graduate Student, 24 Town Engineering., Voice: 515-294-8628, Email: chazaree@iastate.edu).

E N D
CRP551 Introduction to Geographic Information Systems: Project Presentation • Date: April 26, 2006 Civil, Construction and Environmental Engineering Chetan Hazaree(Graduate Student, 24 Town Engineering., Voice: 515-294-8628, Email: chazaree@iastate.edu) Applying GIS For Natural Assets’ Management for Transportation Infrastructure Abstract: Sustainability, environmental and ecological concerns and a harmonious development are becoming the more critical considerations than ever in infrastructure construction. GIS could be applied as a tool in planning and decision making processes. This study recognizes GIS as a tool in selecting the naturally occurring aggregates with sustainability as the prime concern for such selection. Existence of dams (hydrological factor), rendering facilities (wildlife preservation), mines (fuel and other natural resources), loess hills (geological phenomenon) and alluvial deposits (hydro geological phenomenon) are used to demonstrate a primary success of such a tool in further model development by integrating GIS and civil engineering principles. Outputs and Deliverables: The following map shows the impact of various factors on the availability of resources. It can be seen that some of the counties are having very less usable are for quarrying, while in some of the counties, the usable area is available but usable resources are not available. Moreover, this map also shows the spatial distribution of specific sources of aggregates according to their engineering characteristics. • Conclusions: • The current study showed that • It was possible to define natural and manmade features and their interactions using GIS. This study leads to development of such interactions. • It was also possible to define sustainable locations for quarrying of aggregates dredging of natural sand and the quantification of sources. • These quantities could further be applied to develop long term planning and policy making for sustainability. • A phased resources allocation plan could be developed for staggered selection and usage of materials. Moreover facility planning and management could also be assisted by such maps Results: The following table is derived from the final output of the ArcGIS program and shows the values of various attributes. These are further used in multiple querying to obtain the data regarding the availability of land for quarrying of aggregates on the basis of the spatial analysis conducted. A combination of attributes defines the application of a particular piece of land • Limitations: • This study needs a further refinement and implementation at county levels so that the individual data could be integrated to provide a statewide resource status. • The current study is limited by the accuracy of the available databases and maps. For a further improvement in the accuracy of predictions more accurate and precise spatial data would be required. • The current study was limited by the availability of tools in the ArcGIS software. For a better spatial analysis better softwares would be required. • Objectives: • To define existing natural and manmade features and their interactions to develop conservation maps in GIS and study their spatial distribution vis-à-vis the existing geological features • To define the sustainable locations for quarrying of aggregates and dredging of natural sand and to quantify the sources • To apply these quantities in a program for Natural assets’ management for long-term planning of available natural resources • Future Scope of Work: • A 3 dimensional spatial analysis of the available data will provide a better understanding of the existing sources for aggregates • A GIS program could be connected to a quantity surveying software for direct predictions of rock specific and county specific quantitative information • A nationwide model could further be developed to access the availability of natural resources for infrastructure purposes. • Software/Programs: • Geographic Information systems software: ArcGIS 9 • Quantity surveying software • Databases: MS, Excel Materials and Methods: The data required for the complete analysis of the spatial information was obtained from the Iowa State Natural Resources Geographic information systems website. Initially, the coordinate systems, projection systems, units of quantities were checked and made uniform for all the maps used in the analysis. Diverse natural and manmade resources viz. mines, dams, animal rendering facilities, roads, loess hills, etc were recognized as resources either requiring protection or modifications before applications. Surface topography, rivers, alluvial deposits, highways, etc in together forming 24 different maps were integrated using various spatial analysis tools available in the software for forming the final map and several other useful layers and quantitative databases. Depending upon the currently available materials, volumetric quantities obtained from the processed spatial data and further regression analysis employing principles of sustainable resource management, a map capable of defining the material specific locations and the quantities was obtained. This information was further employed in obtaining sustainable quantities of aggregates and alluvial sands for future usage in infrastructure construction. • References: • Thill, J-C, “Geographic Information Systems in Transportation Research”, Pergamon, Oxford, 1e, 2000 • Gurnell, A.M. and Montgomery, D.R., “Hydrological Applications of GIS”, John Wiley and Sons, New York, 2000 • Kavouras, M, “Understanding and Modeling Spatial Change”, in Life and Motion of Socio-economic Units, ed. Bu Masser and Salge, Taylor and Francis, 1e, 2001, pp.49-60. • ESRI Website for ArcGIS software • Webpages of Natural Resources dapartments of the states of Minnesota, Iowa, Missouri and Texas The above map shows a close-up view of the topography affected by the protected area for quarrying of aggregates. These results of the spatial analysis of these contour lines and the protected area are employed in identifying the areas where quarrying can take place. In addition to this, the same can be employed in a quantity surveying and earthwork calculation software programs to calculate the quantities of bedrock available for quarrying. Similarly, these maps could be utilized The above graph shows the normalized availability of land for quarrying of aggregates. This graph is obtained from the spatial analysis conducted using ArcGIS For further information: Please contact at chazaree@iastate.edu or mail me at 24 Town Engineering Building, Iowa State University, Ames, Iowa, USA 50011 Acknowledgements: I thank Ms. Neha Mehrotra for her guidance and support during this study