Download
1 / 17
170 likes | 281 Vues
COMPRO, Nantes Clean Technology Definition ? How to choose ? STARBUS project March 4th, 2008. 1- ADEME Methodology 2- example of Results : Urban Bus, 3- STARBUS project results 4- Conclusions. 1- ADEME evaluation methodology. How to evaluate pathways ??. 1. Evaluate engine AND fuel.

E N D
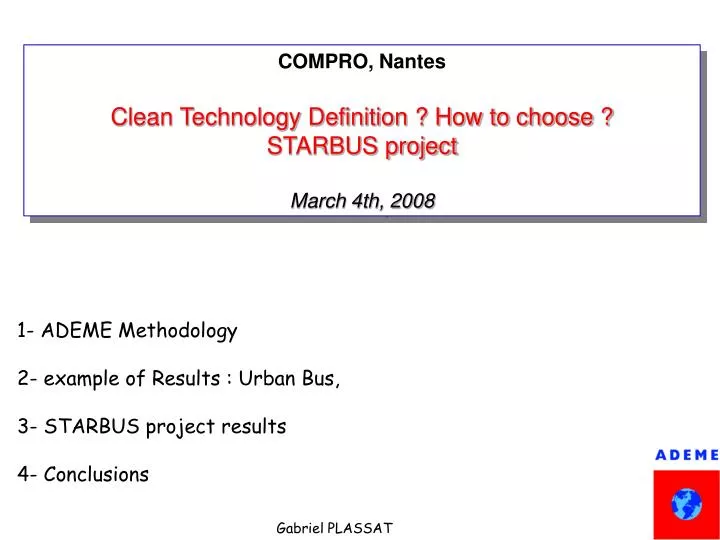
COMPRO, NantesClean Technology Definition ? How to choose ?STARBUS projectMarch 4th, 2008 1- ADEME Methodology 2- example of Results : Urban Bus, 3- STARBUS project results 4- Conclusions
1- ADEME evaluation methodology How to evaluate pathways ?? 1. Evaluate engine AND fuel 2. Quantify Pollutants Emissions, fuel consumption, GHG on real cycles 3. Control durability 4. Evaluate on site fuel consommation, technical problems, costs
Carte pollution air Cadastre population Cadastre population Pollution de l’air Exposition population number of Fonctions expostion-risque cases Epidémiologie PM con- 1 0 centration 3 m in g/m 10 20 30 40 50 60 Nombre de cas de mortalité and et de morbidité Perte production Coûts santé par cas Coûts traitement Douleur et souffrance Economie Coûts externes santé liés à la pollution Source : Ecoplan 2- Bus Results : Comparaison by external costs Example : PM 2.5 Dispersion pollutants & population 336 person.µg/m3/ton particles (extra urban) X Admission to hospital for respiratory pb 3,46.10-6 person.year.µg/m3 (function quantity/response) X Cost for hospital admission for respiratory pb 4320 € = 5 € / ton PM2.5 for respiratory pb Source European study ExternE
2- Bus Evaluation program : conclusions • Pollutants and GHG are influenced by : • vehicle technology and energy efficiency, • fuel pathways (fossil C content) and production efficiency, • real cycle utilisation => NOT REALLY INCLUDED • route choice, • and driving style • Decision to engage a global decision tool realisation at european level • 2006-2008, www.starbus-project.eu
General Objectives • Choose best energetic pathway for urban buses is important : • Public Transport Attractivity (improve fuel efficiency) • City image • But more and more pathways are available : • Diesel reference (with Diesel fuel) • Diesel evolutions DPF, SCR (idem) • LPG or NGV (with Natural Gas, Biogas, Hythane) • Biofuels (Ester, Synthetic, Ethanol) • Hybrid (Diesel) • Each country or even region has also : • its buses manufacturers or energies suppliers • its own biofuel potentiel and biofuel preference
General Objectives • To decide, multiple criteria need to be considered : • Depending on real speed conditions, • Depending on existing bus fleet considered, criteria are : • Pollutants emissions (regulated) • Noise • Green Houses Gases emissions • Economic costs : investments, maintenance (€/km) • => Choice is difficult: • Decisions makers are not always specialists • Criteria are different and not comparable • High potential pathways are often new and also more risky …
3- STARBUS Methodology Step 1 : matrixes creation with on board measurement campaign (PEMS) : NO/NO2 CO2 (fuel consumption) CO, HC Particles Engine speed and torque Noise… Step 2 : Real cycle characterisation using PAMS Done on one Euro 3 bus on real Bus route(s) Measure of engine speed and torque Maps re-use Step 3 : Emissions and consumption calculation Included in decision Tool For all pathways & Euro Performed by fleet manager using web site Decision Tool
3- STARBUS, Material forDatabase creation (Step 1) with PEMS Heated lines Particles analyzer GPS Exhaust flow meter Ambient conditions Torque Gas analyser 12 volt or 24 volt Engine speed CAN signals INCLUDED in web site Decision Tool
3- STARBUS, Material forreal cycle characterisation (Step 2) Complete Portable Activity Measurement System (PAMS) : Other transducers CAN pinches GPS Stand alone data acquisition system CAN to analog converter Integration in single box
3- STARBUS, Results ... Bus route and engine real use Only with PAMS connection on CAN (not intrusive), with public On board
3- STARBUS, Results ... Bus route & emissions estimations … Estimations without measures of : Euro level influence, fuel, bus route, … +
3- STARBUS, Results ... Bus route & NOx emissions estimations …instantaneous and spacialized !! +
3- STARBUS, Results ... Bus route & NOx emissions estimations …instantaneous and spacialized !! + • Next steps : on real cycle characterisation • Emissions estimations for all pathways • External costs aggregation for each • Economic parameters (fuel, station..) • Global comparison
4- Conclusions • Clean Technology Definition & choice : • Real performances (pollutants + GHG from well to wheels) on real cycle • Use of External Costs Aggregation => Environ. Technology Performances • Classic economic parameters addition => Global Technology Performances • Technologies comparisons possible using Starbus Decision Tool. THANK YOU www.starbus-project.eu gabriel.plassat@ademe.fr