Download
1 / 28
280 likes | 284 Vues
Seasonal Prediction System and Applications at the Australian Bureau of Meteorology. Guomin Wang With contributions from Harry Hendon, Oscar Alves, Claire Spillman, Faina Tseitkin and Xiaobing Zhou

E N D
Seasonal Prediction System and Applications at the Australian Bureau of Meteorology Guomin Wang With contributions from Harry Hendon, Oscar Alves, Claire Spillman, Faina Tseitkin and Xiaobing Zhou Centre for Australian Weather and Climate Research:A partnership between the Bureau of Meteorology and CSIRO
Outline • POAMA (Predictive Ocean Atmosphere Model for Australia) & a brief update on ACESS • Great Barrier Reef SST Prediction • Leeuwin Current Prediction
POAMA Overview • The Bureau Dynamical Seasonal Prediction System POAMA • First version went operational in 2002 • A new version (POAMA1.5) became operational recently and a newer version is in development • POAMA development evolves as part of Australian Earth System Modelling project ACCESS • WebpagePOAMA.BOM.GOV.AU
POAMA Model Components Atmospheric Model BAM T47L17 -> T63L17 -> ACCESS(UKMO+LSM) 3h OASIS Coupler time Heat flux, P-E Ocean Model ACOM2 lat/lon/lev=0.5~1.5/2/25 -> AusCOM
Hindcasts Design • Control run initialized at 00Z on the first day of each month, 1980-2006 • Extra 9 members initialized prior to control run initial time in progressively 6 hours interval • Each hindcast is integrated for 9 months
Skill Assessment: ACC for SST and Heat Content SST H300 +1 +3 +5
Skill Assessment: ACC for SST Pacific & Indian Ocean Indices Nino3.4 IOD ACC RMS
ACCESS: The Australian Community Climate and Earth System Simulator Atmosphere Coupler CABLE AusCOM Ocean (MOM4p1 code) AusCOM Sea ice (CICE4 code) Coupled Modelling Team Land Surface/Carbon Cycle Team Model Systems Team Atmospheric Modelling Team Kamal Puri
ACESS Component Model Testing: UM UM OBS BAM
ACESS Component Model Testing: AusCOM AusCOM GODAS Zonal annual mean velocity (1990-2001) along the equator (X Zhou)
Claire Spillman The Great Barrier Reef • Largest coral reef system in the world • Habitat for richly diverse community of species • Sporadic bleaching in GBR since 1982 • Mass bleaching events in 1998 & 2002
Claire Spillman Coral bleaching & what we can do • Loss of symbiotic algae (zooxantheallae) from coral tissues during times of stress • High SST is primary cause of bleaching • Mortality increases with frequency, duration & magnitude of high temperatures • Bleaching in the GBR tends to occur Feb-April • Satellite based now-casts e.g. NOAA Coral Reef Watch Program • Advance warning assists management • Improve recovery times by reducing stress on affected areas e.g. limited access Image courtesy of GBRMPA
Claire Spillman GBR SST Index • Mean SST anomalies in GBR region • Model captures general variability 0.81 0.81 0.63 0.63 0.55 0.55 0.46 Spatial correlation of GBR Index Spillman & Alves, 2008 0.46
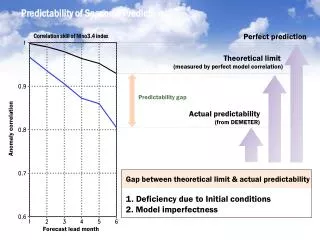
Claire Spillman GBR SST Index Skill • Predictability: Maximum skill limit (perfect model assumption) SST anomaly correlations Spillman & Alves, 2008
Claire Spillman Coral Bleaching HotSpots http://coralreefwatch.noaa.gov • Anomalies calculated using maximum monthly climatology 1982-2006 • Coral bleaching events often noted in areas where HotSpots > 1oC obs Feb 2002 Lead=0 model
Claire Spillman Degree Heating Weeks http://coralreefwatch.noaa.gov obs • Indicates accumulation of thermal stress that coral reefs have experienced over past 12 weeks • DHW = Sum (Weekly Hotspots) over last 12 weeks • Depict the duration and strength of thermal stress that results in bleaching. • Severe coral bleaching likely where DHW > 10 obs model
Claire Spillman Model BleachingProducts obs obs • Weekly products • Combine with GBR Index? • How best to assess skill? model obs model
Claire Spillman Example GBR Forecasts • Daily forecasts produced in real time • Used by GBRMPA with ReefTemp http://poama.bom.gov.au http://www.cmar.csiro.au/remotesensing/ gbrmpa/ReefTemp.htm
Seasonal Prediction of the Leeuwin Current: Observed Features Freemantle sea level (FSL) is indicative of volume transport variation of the Leeuwin Current (M. Feng). Use FSL as a proxy for Leeuwin Current strength.
Pattern Correlation of V anomalies along 32ºS from Reanalyses 82 83 84 85 86 87 88 89 90 91 92 93 94 95 96 97 98 99 00 01 02 03 04 05 06 Years
Fremantle Sea Level and Ocean Heat ContentObservation vs Forecast Skill Obs relationship between H300 and SLA at Freo HCNW = 15-25ºS,112-120ºE H300 ACC Skill at leadtime=7
Fremantle Sea Level and SSTObservation vs Forecast Skill N34 = 5ºS-5ºN; 170º-120ºW
Skill of Fremantle SLA Prediction from Downscaling Scheme Nino4 NWHC Both Combined Persist
FSLA Forecasts 1982-2006 FSLA Obs FSLA Lead 3 FSLA Lead 6 FSLA Lead 9 82 83 84 85 86 87 88 89 90 91 92 93 94 95 96 97 98 99 00 01 02 03 04 05 06 Years
Summary • Introduction of the Australian Bureau’s Dynamical Seasonal Prediction System POAMA and ACCESS • Exploring potential for regional SST forecast products (Great Barrier Reef) with dynamical system • Challenge for regional ocean current simulation and prediction. A downscaling scheme with dynamical model inputs shows useful skill for the Leeuwin Current.