Download
1 / 6
60 likes | 235 Vues
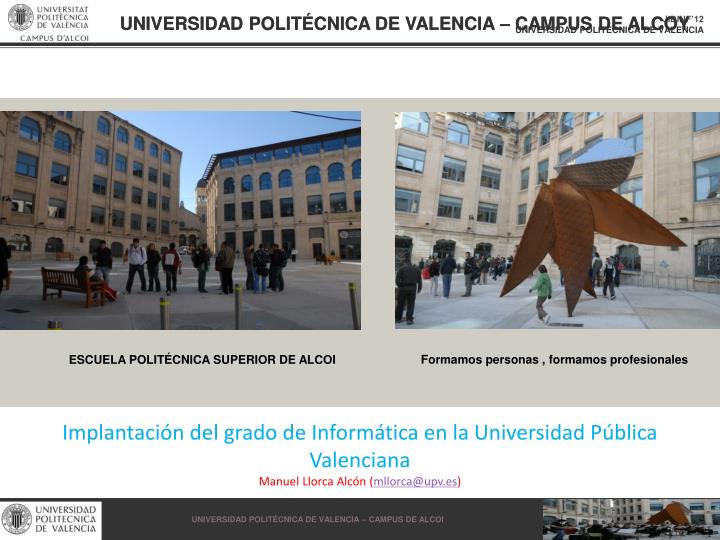
UNIVERSIDAD POLITÉCNICA DE VALENCIA – CAMPUS DE ALCOY. Formamos personas , formamos profesionales. ESCUELA POLITÉCNICA SUPERIOR DE ALCOI. Implantación del grado de Informática en la Universidad Pública Valenciana Manuel Llorca Alcón ( mllorca@upv.es ).

E N D
UNIVERSIDAD POLITÉCNICA DE VALENCIA – CAMPUS DE ALCOY Formamos personas , formamos profesionales ESCUELA POLITÉCNICA SUPERIOR DE ALCOI Implantación del grado de Informática en la Universidad Pública ValencianaManuel LlorcaAlcón (mllorca@upv.es) UNIVERSIDAD POLITÉCNICA DE VALENCIA – CAMPUS DE ALCOI
Contexto • 6 grados (4 industriales – GIM, GIE, GDIS, GIQ -, 1 GADE y 1 GII) • En el año 2014 estarán en marcha 3 masters • Número total de alumnos matriculados en grado: • EPSA: 1426 • GII: 181 (12,69 % del total) • Oferta pública • Campus: 450 alumnos • GII: 50 alumnos (11 % del total)
Oferta formativa • Tasa oferta demanda (GII) • 2011/2012: 274 % (180 % EPSA) • 2010/2011: 206 % (184 % EPSA) • Tasa de matriculación (GII) • 2011/2012: 126 % (97 % EPSA) • 2010/2011: 96 % (117 % EPSA)
Distribución e indicadores • Horarios • 1 y 3 curso: Mañanas • 2 y 4 curso: Tardes • Satisfacción media de los alumnos • Año 2011/2012: 7,55 (7,38 EPSA) – 25 profesores • Máx: 9,44 • Mín: 3,02 • Año 2010/2011: 7,59 (7,26 EPSA) – 14 profesores • Máx: 9,24 • Mín: 4,86
Indicadores • Tasas de presentados(GII) • Año 2011/2012 • 1er curso: 92,03 % - 88,08 % evaluación continua • 2º curso: 96,72 % - 95,93 % evaluación continua • Año 2010/2011 • 1er curso: 87,35 %. 79,13 % evaluación continua • Tasa de rendimiento (GII) • Año 2011/2012: 82 % (80 % EPSA) • Año 2010/2011: 79 % (75 % EPSA)