Download
1 / 31
310 likes | 497 Vues
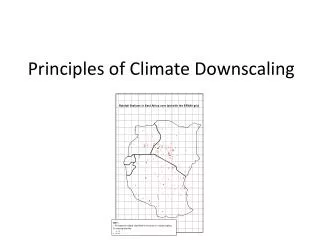
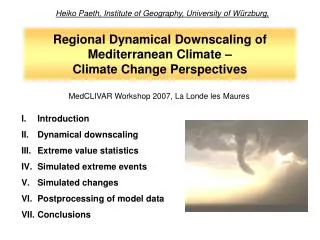
Regional climate downscaling theory. “Unintelligent downscaling”. IPCC Fourth Assessment Report ensemble range for annual precipitation change across Yemen by the 2050s under SRES A2 emissions (left: driest model; right: wettest model). Data source: Climate Wizard.

E N D
“Unintelligent downscaling” IPCC Fourth Assessment Report ensemble range for annual precipitation change across Yemen by the 2050s under SRES A2 emissions (left: driest model; right: wettest model). Data source: Climate Wizard
What the climate model centres provide… 300km 50km downscaling 10km 1m …what (some think) the climate impacts community needs. Point
Justification for downscaling ...studies of the impacts of projected global warming on a regional scale...necessitates the development and application of scenarios to specific problems... Cohen (1990) ...Even if global climate models in the future are run at high resolution there will remain the need to ’downscale’ the results from such models to individual sites or localities for impact studies... DOE (1996) ...‘downscaling’ techniques, [are] commonly used to address the scale mismatch between coarse resolution global climate model (GCM) output and the regional or local catchment scales required for climate change impact assessment and hydrological modelling... Fowler & Wilby (2007)
NARCCAP RCM domains Source: http://www.narccap.ucar.edu/data/domain-plot.png
Verifying regional climate model skill Observed (left column) and RegCM3 simulation (right column) of near surface winds, precipitation and surface temperature for summer 1987-2000. Source: Pal et al. (2007)
Verifying regional climate model skill Comparison of observed (UDEL, left panel) and dynamically downscaled (MMFI, right panel) average winter precipitation (mm/day) for 1980-2004. Source: http://www.narccap.ucar.edu/results/ncep-results.html
How an RCM sees complex topography Source: Ferranti (2007)
Heavy rainfall biases (PRUDENCE) Estimates of return value (in mm) for 1 day, 5 year event for grid cells. Source: Fowler et al. (2007)
Uncertainty in projections (PRUDENCE ) Estimates of percent change in the 1-day 5-year and 10-day 5-year return values, respectively, for each RCM and each season under the SRES A2 2071–2100 emissions scenario for Southeast England (SEE) Source: Fowler & Ekstrom (2009)
PRECIS: DIY regional downscaling PRECIS model projections of changes in summer monsoon rainfall by the 2080s, under SRES A2 and B2 emissions scenarios. Source: Kumar et al. (2006)
Statistical downscaling methods • Applicable to: • Sub-grid scales (small islands, point processes) • Complex/ heterogeneous environments • Extreme events • Exotic predictands • Transient change/ ensembles
A downscaling “manifesto” (Wigley et al., 1990) • Key issues • Predictor selection • Local variations in predictability • Stationarity of scaling • Predictor domain • GCM biases
Weather classification schemes to condition daily surface variables
Weather classification: LWT scheme to condition daily rainfall Conditional probabilities of rainfall and mean intensity in the Cotswolds, UK associated with the seven main Lamb Weather Types (LWT), 1891-1910. Key: Anticyclonic (A), Westerly (W), Cyclonic (C), Northery (N), North-westerly (NW), Southerly (S) and Easterly (E) patterns.
Key publications reflecting the early development of daily weather generators
Precipitation occurrence process The transition probabilities for Cambridge, UK are as follows dry-to-wet (p01) = 0.291 wet-to-wet (p11) = 0.654 Therefore it follows (for a two state model) that dry-to-dry (p00) = 1 - p01 = 0.709 wet-to-dry (p10) = 1 - p11 = 0.346
Precipitation amount distributions Daily precipitation totals at Addis Ababa, Ethiopia 1963-1988 modelled using gamma, fourth root and stretched exponential distributions.
EARWIG: A “point-n-click” weather generator Example screen for the Environment Agency Rainfall and Weather Impacts Generator (EARWIG). The software is based on the Neyman-Scott Rectangular Pulse (NSRP) weather generator. See: Kilsby et al. (2007)
Transfer function approaches Synoptic controls of London’s urban heat island during the summer of 1995 Grid boxes of GCM data available for downscaling to sites across the UK.
Validation of modelled nocturnal UHI intensity for the summer of 1995 Grey lines denote observations, red the modelled UHI
Validation of modelled ozone concentrations in central London Downscaled maximum daily ozone concentrations for Russell Square, London. Source: Wilby (2008)
Uncertainty in UHI due to GCM output Twenty-first century nocturnal urban heat island intensity in London downscaled from four GCMs under SRES A2 emissions. Source: Wilby (2008)