Download
1 / 1
10 likes | 150 Vues
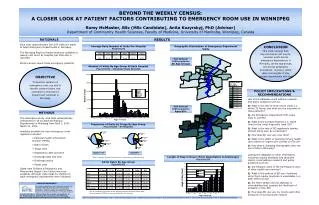
Cadence Metric Parameters. THE WEEKLY. Measured quantities. Symbol. Units. Pixel size. Ps. microns. Bright pixels. Pb. % of pixel count. Dark pixels. Pd. % of pixel count. Traps. Pt. rows and columns. Readout noise. Nrd. e- rms. Quantum efficiency. Q . % efficient at .

E N D
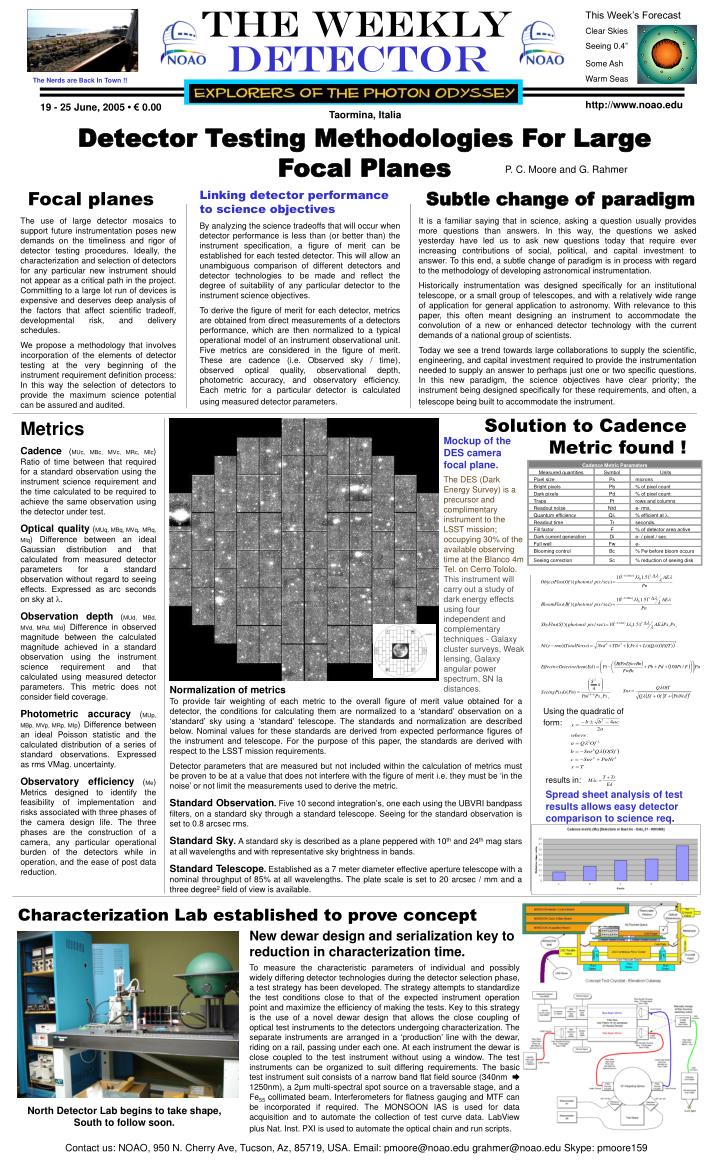
Cadence Metric Parameters THE WEEKLY Measured quantities Symbol Units Pixel size Ps microns Bright pixels Pb % of pixel count Dark pixels Pd % of pixel count Traps Pt rows and columns Readout noise Nrd e- rms. Quantum efficiency Q % efficient at . Readout time Tr seconds. Fill factor F % of detector area active Dark current generation Di e- / pixel / sec. Full well Fw e- Blooming control Bc % Fw before bloom occurs Seeing correction Sc % reduction of seeing disk This Week’s Forecast Clear Skies Seeing 0.4” Some Ash Warm Seas DETECTOR The Nerds are Back In Town !! http://www.noao.edu 19 - 25 June, 2005 •€ 0.00 Taormina, Italia Detector Testing Methodologies For Large Focal Planes P. C. Moore and G. Rahmer Focal planes Linking detector performance to science objectives Subtle change of paradigm The use of large detector mosaics to support future instrumentation poses new demands on the timeliness and rigor of detector testing procedures. Ideally, the characterization and selection of detectors for any particular new instrument should not appear as a critical path in the project. Committing to a large lot run of devices is expensive and deserves deep analysis of the factors that affect scientific tradeoff, developmental risk, and delivery schedules. We propose a methodology that involves incorporation of the elements of detector testing at the very beginning of the instrument requirement definition process: In this way the selection of detectors to provide the maximum science potential can be assured and audited. It is a familiar saying that in science, asking a question usually provides more questions than answers. In this way, the questions we asked yesterday have led us to ask new questions today that require ever increasing contributions of social, political, and capital investment to answer. To this end, a subtle change of paradigm is in process with regard to the methodology of developing astronomical instrumentation. Historically instrumentation was designed specifically for an institutional telescope, or a small group of telescopes, and with a relatively wide range of application for general application to astronomy. With relevance to this paper, this often meant designing an instrument to accommodate the convolution of a new or enhanced detector technology with the current demands of a national group of scientists. Today we see a trend towards large collaborations to supply the scientific, engineering, and capital investment required to provide the instrumentation needed to supply an answer to perhaps just one or two specific questions. In this new paradigm, the science objectives have clear priority; the instrument being designed specifically for these requirements, and often, a telescope being built to accommodate the instrument. By analyzing the science tradeoffs that will occur when detector performance is less than (or better than) the instrument specification, a figure of merit can be established for each tested detector. This will allow an unambiguous comparison of different detectors and detector technologies to be made and reflect the degree of suitability of any particular detector to the instrument science objectives. To derive the figure of merit for each detector, metrics are obtained from direct measurements of a detectors performance, which are then normalized to a typical operational model of an instrument observational unit. Five metrics are considered in the figure of merit. These are cadence (i.e. Observed sky / time), observed optical quality, observational depth, photometric accuracy, and observatory efficiency. Each metric for a particular detector is calculated using measured detector parameters. Solution to Cadence Metric found ! Metrics Mockup of the DES camera focal plane. Cadence (MUc, MBc, MVc, MRc, MIc) Ratio of time between that required for a standard observation using the instrument science requirement and the time calculated to be required to achieve the same observation using the detector under test. Optical quality (MUq, MBq, MVq, MRq, MIq)Difference between an ideal Gaussian distribution and that calculated from measured detector parameters for a standard observation without regard to seeing effects. Expressed as arc seconds on sky at . Observation depth (MUd, MBd, MVd, MRd, MId)Difference in observed magnitude between the calculated magnitude achieved in a standard observation using the instrument science requirement and that calculated using measured detector parameters. This metric does not consider field coverage. Photometric accuracy (MUp, MBp, MVp, MRp, MIp) Difference between an ideal Poisson statistic and the calculated distribution of a series of standard observations. Expressed as rms VMag. uncertainty. Observatory efficiency (Me)Metrics designed to identify the feasibility of implementation and risks associated with three phases of the camera design life. The three phases are the construction of a camera, any particular operational burden of the detectors while in operation, and the ease of post data reduction. The DES (Dark Energy Survey) is a precursor and complimentary instrument to the LSST mission; occupying 30% of the available observing time at the Blanco 4m Tel. on Cerro Tololo. This instrument will carry out a study of dark energy effects using four independent and complementary techniques - Galaxy cluster surveys, Weak lensing, Galaxy angular power spectrum, SN Ia distances. Normalization of metrics To provide fair weighting of each metric to the overall figure of merit value obtained for a detector, the conditions for calculating them are normalized to a ‘standard’ observation on a ‘standard’ sky using a ‘standard’ telescope. The standards and normalization are described below. Nominal values for these standards are derived from expected performance figures of the instrument and telescope. For the purpose of this paper, the standards are derived with respect to the LSST mission requirements. Detector parameters that are measured but not included within the calculation of metrics must be proven to be at a value that does not interfere with the figure of merit i.e. they must be ‘in the noise’ or not limit the measurements used to derive the metric. Standard Observation.Five 10 second integration’s, one each using the UBVRI bandpass filters, on a standard sky through a standard telescope. Seeing for the standard observation is set to 0.8 arcsec rms. Standard Sky.A standard sky is described as a plane peppered with 10th and 24th mag stars at all wavelengths and with representative sky brightness in bands. Standard Telescope.Established as a 7 meter diameter effective aperture telescope with a nominal throughput of 85% at all wavelengths. The plate scale is set to 20 arcsec / mm and a three degree2 field of view is available. Using the quadratic of form: results in: Spread sheet analysis of test results allows easy detector comparison to science req. Characterization Lab established to prove concept New dewar design and serialization key to reduction in characterization time. To measure the characteristic parameters of individual and possibly widely differing detector technologies during the detector selection phase, a test strategy has been developed. The strategy attempts to standardize the test conditions close to that of the expected instrument operation point and maximize the efficiency of making the tests. Key to this strategy is the use of a novel dewar design that allows the close coupling of optical test instruments to the detectors undergoing characterization. The separate instruments are arranged in a ‘production’ line with the dewar, riding on a rail, passing under each one. At each instrument the dewar is close coupled to the test instrument without using a window. The test instruments can be organized to suit differing requirements. The basic test instrument suit consists of a narrow band flat field source (340nm ➨ 1250nm), a 2μm multi-spectral spot source on a traversable stage, and a Fe55 collimated beam. Interferometers for flatness gauging and MTF can be incorporated if required. The MONSOON IAS is used for data acquisition and to automate the collection of test curve data. LabView plus Nat. Inst. PXI is used to automate the optical chain and run scripts. North Detector Lab begins to take shape, South to follow soon. Contact us: NOAO, 950 N. Cherry Ave, Tucson, Az, 85719, USA. Email: pmoore@noao.edu grahmer@noao.edu Skype: pmoore159