Download

1 / 31
430 likes | 884 Vues
Hydrographic Surveying. Datums &Tides Why Multibeam?. Datums and Tides. Mean Low Tide versus Mean Lower Low Water. And the winner is……….!.

E N D
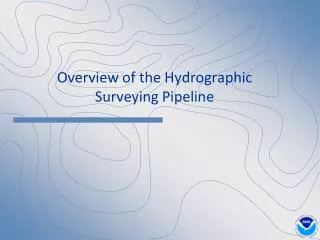
Hydrographic Surveying • Datums &Tides • Why Multibeam?
Datums and Tides Mean Low Tide versus Mean Lower Low Water And the winner is……….!
The following slide is taken directly from the NOAA/TCOON web sites pages that gives the official relationships for the various Sea Level Datums (Mean Sea Level and it’s various statistical offsets) and the Land (Terrestrial) Datums (NAVD88 and Mean Low Tide) for the Rainbow Bridge on the Neches River Channel. This location has been chosen because it is one of the (currently) few NOAA tide gauge sites for which data is available in real time on the internet, and has published the relationship between the Sea and Terrestrial datums. One thing should be borne in mind. Mean Sea Level changes both by location around the coastline of the U.S. and over long periods of time. The relationships at the Rainbow Bridge do NOT hold true anywhere else - although the differences MAY be minor.
The relationships shown here are given reference to an arbitrary “station datum”. Following slides have changed this to make things relative to Mean Low Low Water via high level math (addition and subtraction!!) See slide #12 and #13 for definitions of these datums. NAVD 88 elevation updated 5/2013, stated accuracy is 0.028m (about 1 inch). These datums are marked preliminary until the 2013 levels are run. Courtesy TCOON Web Site
SIMPLE! Take two aspirin and call 713-690-4626, ask for Chris or Mike and have your credit card ready! Just joking about the credit card!
The following are provided for reference purposes - if you are feeling bold.
Links http://tidesandcurrents.noaa.gov/publications/tidal_datums_and_their_applications.pdf http://www.ngs.noaa.gov/datums/vertical/VerticalDatums.shtml http://www.cbi.tamucc.edu/cbi/data http://tidesandcurrents.noaa.gov/ http://tidesandcurrents.noaa.gov/datum_options.html
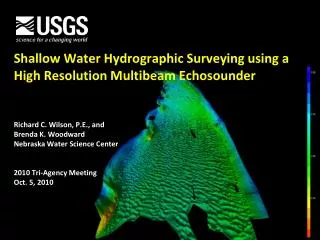
Why Multibeam? R2Sonic 2024 Odom MB-1 And new 2020 Reson 7125 Geoacoustics “Geoswath” Edgetech 4600 Swath/Sidescan
Example #1 Bottom Elevation Contour Chart (Multibeam)
Bottom Elevation Contour Chart (Single Beam) Dock Face Survey Lines (Single Beam) Channel Centerline
Multibeam Surveys are faster to execute, especially for larger areas and in the case of busy docks. • They give 100% bottom coverage (single beam surveys at 50 feet spacing give only 28%!) • The data can still be sectioned and volumes calculated by the average end area method but we can now also use a full terrain modelling approach. • New system can beam-steer and look up under docks, moored barges or shallow draft vessels (depending on space between the hull and bottom) • Some systems also provide sidescan sonar type imagery from the amplitude returns (not as good as a specialist sidescan sonar but no co-location issues) • More expensive than single beam (30 to 50%) • Data takes longer to edit and produce final deliverables