Download
1 / 29
360 likes | 725 Vues
Measuring Image Quality. Heath Nielson. Measuring Quality What. Identify and measure attributes of an image that can be used to determine whether the perceived quality meets the expectations of the organization. Measuring Quality Why. Should be part of any document processing system

E N D
Measuring Image Quality Heath Nielson
Measuring QualityWhat • Identify and measure attributes of an image that can be used to determine whether the perceived quality meets the expectations of the organization.
Measuring QualityWhy • Should be part of any document processing system • Guarantee consistency • Useful for identifying upstream process problems • Manual • Automated
Measuring QualityHow • Subjective • Easy to do • Not always predictable nor consistent • Objective • Predictable and consistent • Hard to measure
Contributing factors affecting quality • State of original document • Digitization • Resolution • Lighting • Exposure • Focus • Post-processing • Rotation • Cropping • Contrast enhancement • Lossy compression
Quality StandardsDIRT (Digital Image Research Team) • Composed of operational and development personnel • Identify image attributes affecting quality • Provide, where possible, metrics to measure those attributes • Determine acceptable ranges for attributes • Provide tools and training to facilitate consistent quality
Quality StandardsDIRT Specification • Defines image attributes and desirable values for each • Tonal Range • Tonal Resolution • Even Exposure • Spatial Resolution • Contrast • Colorspace • Focus • Blur • File format • File name • Dimensions • Size • Complete Capture • Orientation • Skew • Fixity
Subjective Evaluation • Direct Numerical Category Scaling • Subjects classify images into a number of categories • Usually use a numerical scale e.g. (1=Bad, 5=Good) • Subjects tend to use separate internal scales • Different “types” of images • Different types of distortion • Functional Measurement Theory • Compares image qualities • Subjects indicate which image is preferred • More evaluations required • Each sampled image must be compared with every other sampled image
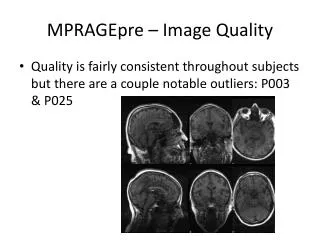
Subjective EvaluationJpeg Compression • Sample images • Randomly selected • Includes image from both scanned microfilm and camera capture • Each image compressed at several predetermined settings • The original, uncompressed image is also included • Images were presented randomly • About 10% of the time a previously evaluated image is presented for reevaluation • Each image was evaluated by 3 different subjects
Subjective EvaluationJpeg Compression • Direct category scaling method • Asked to classify images on a scale of 1-5 • Zoom image 1-100% • Pan around • No time limit • No calibration of monitors or ambient light
Objective Measures • No-Reference • No reference image available • “Blind” reference • Reduced-Reference • Set of extracted features from reference image are used • Full-Reference • A complete reference image is available
MSE • Measures how much something changed but not how important that change is • Ranges from 0 (exactly the same) to infinity
MSE JPEG Quality 4.6 80 35 15.1 5 111.2
Ratio between the maximum possible power and the power of corrupting noise introduced by compression Measured using the logarithmic decibel scale Higher values, better quality Typical values 30-50db PSNR
PSNR JPEG Quality 80 41.5 35 36.4 5 27.7
Universal Quality Index • Proposed by Wang and Bovik (2002) • Attempts to measure: • Loss of correlation • Luminance distortion • Contrast distortion
Universal Quality Index JPEG Quality 80 0.943 35 0.821 5 0.428
Conclusion • Refine subjective results • Correlate subject results to objective • Evaluate other published quality metrics • Define our own