Download
1 / 15
150 likes | 157 Vues
Flood Mapping in Korea. 2003. 10. Yang-Su Kim. National Institute for Disaster Prevention. Ministry of Government Administration and Home Affairs. Republic of Korea. 60. Total economic loss. 50. Average economic loss in ten years. 40. 30. Annual damage(thousand million U.S. dollars).

E N D
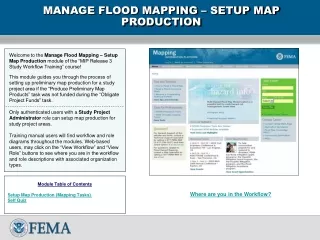
Flood Mapping in Korea 2003. 10 Yang-Su Kim National Institute for Disaster Prevention Ministry of Government Administration and Home Affairs Republic of Korea
60 Total economic loss 50 Average economic loss in ten years 40 30 Annual damage(thousand million U.S. dollars) 20 10 0 1950 1960 1970 1980 1990 1998 Background • Global costs of extreme weather events(IPCC, 2001) Years • Records of flood frequency and magnitude have been updated • almost every year • Limitation of structural countermeasures • Needs to strengthen the non-structural countermeasures
Flood Mapping • Past Flood Inundated Area Map • Flood-prone Area Map • Flood Hazard Map Flood Inundation Area Map(FIAP) Flood Hazard Map computer system Flood-Prone Area Map(FPAM) Local data
Production of Flood Inundated Area Map • Investigation of inundated area for every big flood
Production of Flood Inundated Area Map • Inundated Area Map of Anseong City in August 2000
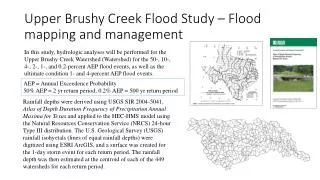
Production of Flood-prone Area Map(Flood Risk Map) • Projects for 7 vulnerable reaches in Han river basin • from 2000 to 2002 were performed • Nakdong River basin project was started in 2003
Flood Hazard Map / Management System • Background of system development • Hard to keep paper maps • Hard to provide to practical user • Installed in 36 the local governments • Computer System Configuration
Flood Hazard Map / Management System • System function
Flood Hazard Map / Management System • Public building • Gauging station • Pumping station • Inundation depth sign board • Bank breaking point • Vulnerable area for flooding
Work Division for Flood Mapping Total Data Management Production of FHM Design of FIAM & FPAM • Disaster investigation • - Flood inundation • - Land slide • bank breaking, etc • Design of FIAM • Design of FPAM • - Flood simulation FIAM & FPAM NDMS DB Design of FHM Local Gov Client Input Distribution and usage of FHM Local Gov Client
Conclusion • How to design Flood Hazard Map more efficiently? • How to distribute the Flood Hazard Map? • How to design the FPAM for regions where data are poor?