Download
1 / 10
100 likes | 196 Vues
Modeling the population dynamics of HIV/AIDS. Brandy L. Rapatski James A. Yorke Frederick Suppe. Primary Goal. To determine how infectiousness of HIV varies as an untreated infected gay man progresses through 3 stages of the disease .

E N D
Modeling the population dynamics of HIV/AIDS Brandy L. Rapatski James A. Yorke Frederick Suppe
Primary Goal To determine how infectiousness of HIV varies as an untreated infected gay man progresses through 3 stages of the disease. Any attempt to measure these infectivities must be a highly mathematical analysis of available data.
Modeling SF Gay Population • We model the San Francisco population as described by the San Francisco City Clinic Cohort Study (SFCCC).
San Francisco Transmission Dynamics • Analysis of 1978-1984 • Six Activity Levels (from survey data) • Infectiousness depends on stage (3 stages) • Bathhouse Assumption • Men vary in how often they visit the bathhouses but once inside choose partners at random. Model must account for 1978-1984 SF data
Infectivity Per Contact Conclusions 2/3 Year 7 Years 3 Years Death First Stage Infectivity 0.015 Second Stage Infectivity 0.006 Third Stage Infectivity 0.223 0.015*2/3=0.010 0.006*7=0.042 0.223*3=0.669 Total infections = 0.721
Viral Loads Our infectivities correspond to viral loads [------------------2nd Stage-------------------] [1st Stage] [-----3rd Stage----] Variable viral loads over the course of a typical untreated individual’s HIV infection.
The infectivities reflect the pattern of semen infectivity. Though infectivity depends on mode of transmission, third stage remains most infectious.
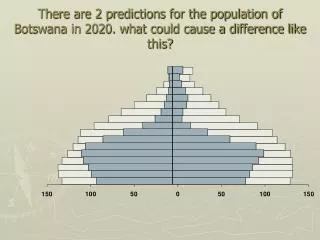
Person-to-Person Transition Rate Africa: 1 person to 1,000,000 in approximately 40 years (1950-1990) 1.3 years 1.6 ~31 generations in 40 years 6.9 years 10 ~6 generations in 40 years
Contact Information BLR@math.umd.edu http://www.killi.com/brandy