Download
1 / 30
300 likes | 319 Vues
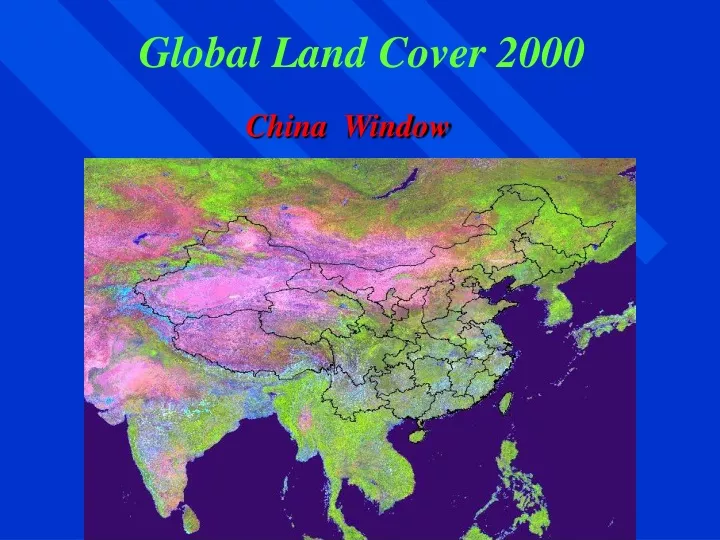
China Window. Global Land Cover 2000. Data preparation climatic stratification of China VGT data’s preparation remove the cloud contamination synthesizing the geo-code image reference data Classification system the land cover classification system-LCCS

E N D
China Window Global Land Cover 2000
Data preparation • climatic stratification of China • VGT data’s preparation • remove the cloud contamination • synthesizing the geo-code image • reference data • Classification system • the land cover classification system-LCCS • stratum’s land cover classes from LCCS • Classification processand result • Accuracy assessment
Working process Temperature Elevation Precipitation Accumulated temperature Aridity index Non-forest land Forest land Geo-image Accuracy assessment GIS information GIS information database Climatic stratification Unsupervised classification Synthesized imaged Vegetation data integrity Phase 1 Phase 2 Phase 3 • Phase 1:climatic stratification and data preparation. • Phase 2:unsupervised classification and labeling. • Phase 3:accuracy assessment and result integrity.
Climatic stratification Why should we performed the climatic stratification ? Vegetation growth and distribution are most associate with climatic factors such as temperature and moisture. The study area was divided into sub-area based on temperature and moisture condition, this is called climatic stratification. This will contribute to ⑴ simplifying the study area into small and environmentally homogeneous sub-region, which will help to reduce the confusion in different sub-regions. ⑵ increasing the mapping accuracy .
the climatic stratification in China According to the situation of the aridity and the above ten accumulated temperature in centigrade, at the same time considering the region integrity, the study area was divided into nine stratum. Note: T is the above ten accumulated temperature in centigrade. Ar is the aridity: Ar=0.16×T/r, where r is the precipitation in millimeter.
Which datais used for classification ? Original images 36 ten-days NDVI images Environment data
Data preparation: • Removal cloud contamination With the Harmonic Analysis of Time Series (HANTS) technique , the cloud contamination were removed for 36 NDVI images. before removing cloud contamination after removing cloud contamination the first ten days in August
Synthesizing of the geo-code image • Geo-code data was used as a single band for the classification. • Annual average temperature and precipitation were interpolated into 1km resolution • GS+’cokriging method • 313 meteorology stations • DEM data was generated from 1:1 million topographical map.
AHP METHORD Firstly, three climatic images were normalized to eliminate the dimension. Secondly, to construct the judging matrix. For each sub-region, the matrix is given by the experts who have abundance geography knowledge. Because of the subjectivity of different experts, we use a coherence index to test the accuracy. For the three factors, three dimension matrix is constituted, and the eigenvector and the maximum eigenvalue (max) can be gained. The eigenvector of the P matrix’s maximum eigenvalue that passed the consistency test is the fraction of the climatic factors. The consistency test is calculated with the formula : For every different dimension matrix, three have a different RI, if CI/RI≤0.1, the value given by the expert passed the test.
This time, we only selected three experts to assign the matrix values. Following is the max-eigenvalue and CR value of nine stratums. The synthesizing image G(x,y) is calculated by the following formula, G(x,y)= ƒ1×T(x,y)+ ƒ2×R(x,y)+ ƒ3×E(x,y) The G(x,y) will be regarded as a band to take part in the classification. The three factors’ coefficient is showed in the following table.
nwc Synthesized geo-code image sj im nec nc cc tb ec sc
Reference data l1:1,000,000 Vegetation map in China l1:1,000,000 land-use map of China l1:1,000,000 administration map lBeijing, China remote sensing index map l1km land-use data
Classification system According to GVMU’s requirement, the classification is performed by using FAO’s classification system—LCCS, For the nine sub-region, there are 21 classes.
Classification process and result We regarded the geo-code image as a single band and added to the NDVI image(which already had 36 bands) the sub-region was masked into forest land and non-forest land. Unsupervised classification is performed in each sub-region. For the NWC, IM and SJ region, because of the poor vegetation, the classification result with NDVI is not satisfied. The original image of the last ten days in August is used. For the city, the unsupervised classification is impossible because of the different density and chroma, we used supervised classification to gain the main cities. overlaying forest and non-forest into one image. And then mosaic nine sub-region into whole one.
Accuracy assessment three sample sites: Dingxi county in GANSU province Yanchi county in NINGXIA province Daqing city in HEILONGJIANG province The reference data were land cover maps at a scale of 1:100 000, interpreted from TM data in 2000 with intensive field works. These existing land cover maps were rasterized into grid data with 100 meters. And the land cover data from VGT S10 data was converted into 100 meters resolution. There are 10 classes in the sample sites: broadleaved deciduous forest, slope grassland, plain grassland, meadow, lake, swamp, farmland, bush, desert grassland, desert.
File title : CHINA Data type : Unsigned 8-bit File type : Thematic Columns : 8169 Rows : 4836 ref. System : Geographic Lat/Lon Spheroid : Krasovsky Datum : Krasovsky Unit dist : 1 ULX : 68.10076166 LRX : 141.02932113 ULY : 57.39784891 LRY : 14.22821312 Resolution : 0.00892857 Meta data of Land cover data
Conclusion The land cover mapping was a complex works. For the area with poor vegetation, as north western China, instead of using NDVI dataset, the original image was used. This time, only one dataset of last decade of August image, we believe that multi-temporal images can be better. The geographic factors is useful for the classification of the vegetation distribution. And the AHP method is tested to be reliable, it will be used widely in the future. For the low and medium scale land cover mapping, the stratification was necessary. For all the land-cover classes, water bodies is easy to identify, and for the urban area, it is impossible to identify with NDVI data. The supervised classification of original image was used for the urban area. Hants program greatly improved the classification which removed the cloud and generated consistent dataset for same class.