Download
1 / 27
270 likes | 391 Vues
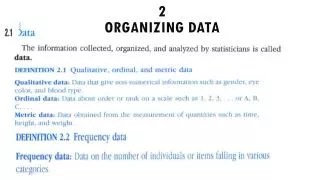
Chapter 2 Organizing the Data. Nominal Data and Distributions. Frequency distribution of nominal data consists of two columns: Left column has characteristics (e.g., Response of Child) Right column has frequency ( f ). Comparing Distributions. Comparisons clarify and add information.

E N D
Nominal Data and Distributions • Frequency distribution of nominal data consists of two columns: • Left column has characteristics (e.g., Response of Child) • Right column has frequency (f)
Comparing Distributions • Comparisons clarify and add information
Rate of Change • Compare the same population at two points in time • Rate of Change = time 2f – time1f time 1f (100)* 1Source: National Crime Victimization Survey
Flexible Class Intervals N = 77688
Cross Tabulations – Victim-Offender Relationship by Gender of Victim for Homicides in US for 2005 (With Row%)
Cross Tabulations – Victim-Offender Relationship by Gender of Victim for Homicides in US for 2005 (With Row%)
Cross Tabulations – Victim-Offender Relationship by Gender of Victim for Homicides in US for 2005 (With Row%)
Cross Tabulations – Victim-Offender Relationship by Gender of Victim for Homicides in US for 2005 (With Row%)
Histogram of Distribution of Children in Little Rock Community Survey
Number of Adolescents (< 18 y/o) Using for the First Time by Month
Kurtosis Leptokurtic Platykurtic Mesokurtic Some Variation in Kurtosis among Symmetrical Distributions
Skewness Negatively skewed Positively skewed Symmetrical (Normal) Three Distributions Representing Direction of Skewness