Download
1 / 26
260 likes | 364 Vues
Evaluation of wet scavenging for the May 29, 2012 DC3 severe storm case. Megan Bela ( U. Colorado) , Mary Barth ( NCAR), John Wong, O. Brian Toon (U. Colorado), Hugh Morrison, Morris Weisman, Kevin Manning, Glen Romine, Wei Wang ( NCAR), Kristin Cummings ( U. Maryland),

E N D
Evaluation of wet scavenging for the May 29, 2012 DC3 severe storm case Megan Bela(U. Colorado), Mary Barth(NCAR), John Wong, O. Brian Toon(U. Colorado), Hugh Morrison, Morris Weisman, Kevin Manning, Glen Romine, Wei Wang (NCAR), Kristin Cummings (U. Maryland), Kenneth Pickering (NASA/GSFC), and the DC3 Science Team
Wet Scavenging and Lightning-NOx in WRF • WRF-Chem • Wet scavenging of trace gases based on Neu-Prather parameterization connected to Lin scheme cloud physics (Pfister et al., WRF workshop, 2011) • Now connected to Morrison cloud physics scheme • Lightning-NOx parameterization split into two parts • Lightning flashrate predicted in WRF/phys • Lightning-NOx production predicted in WRF/chem • DC3 Field Campaign • Offers chance to evaluate these parameterizations via case studies
Deep Convective Clouds and Chemistry (DC3) Experiment To characterize thunderstorms and how they process chemical compounds that are ingested into the storm (transport, scavenging, lightning and NOxproduction, chemistry) To learn how the air that exits the storm in the upper troposphere (UT) changes chemically during the next day (chemical aging) May-June 2012
Strategy for Sampling Near Storms RO2 or HOx NOx H2O2 CH3OOHCH3OH CH2O CH3COCH3 O3
29 May 2012Oklahoma Severe Storm photo from Don MacGorman
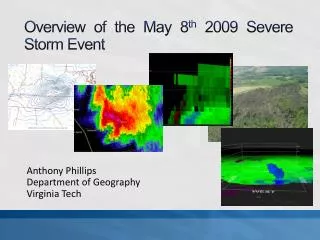
WRF-Chem Setup 15 km CONUS: Grell 3D (G3) convective parameterization 3km: explicit convection MOZART chemistry, GOCART aerosols with radiative feedback ∆x = 3 km ∆x = 15 km WRF Max. 10 cm Radar Reflectivity (dBZ), May 30, 2012 00Z
Wet Scavenging Evaluation 3km: explicit convection MOZART chemistry, GOCART aerosols with radiative feedback ∆x = 3 km ∆x = 15 km WRF Max. 10 cm Radar Reflectivity (dBZ), May 30, 2012 00Z
WRF represents storm location but initiates early and has a larger area of high reflectivity 2012-05-29 21Z • WRF • Maximum 10cm reflectivity (dBZ) NEXRAD Composite Reflectivity
WRF represents storm location but initiates early and has a larger area of high reflectivity 2012-05-29 22Z • WRF • Maximum 10cm reflectivity (dBZ) NEXRAD Composite Reflectivity
WRF represents storm location but initiates early and has a larger area of high reflectivity 2012-05-29 23Z • WRF • Maximum 10cm reflectivity (dBZ) NEXRAD Composite Reflectivity
WRF represents storm location but initiates early and has a larger area of high reflectivity • WRF • Maximum 10cm reflectivity (dBZ) 2012-05-30 00Z NEXRAD Composite Reflectivity
WRF represents storm location but initiates early and has a larger area of high reflectivity 2012-05-30 01Z • WRF • Maximum 10cm reflectivity (dBZ) NEXRAD Composite Reflectivity
Neu and Prather (2012) wet scavenging was coupled to MOZART chemistry and Morrison microphysics gas Henry’s Law cloud water retention factor = 1 rain hail snow evaporation gas Simulations: • With the wet scavenging • Without the wet scavenging Scavenged: HNO3, H2O2, HCHO, CH3OOH Transport only: CO, O3, NMHCs
Compare vertical profiles from observations and model output CO O3 Observed (Preliminary) Inflow = DC8 and GV measurements restricted to just before/during storm Outflow = DC8 and GV measurements when sampling anvil outflow, with stratospheric air (O3 > 100 ppb, CO < 100 ppb) removed Inflow = Clear sky points just before storm where aircraft flew Outflow = WRF anvil region where CO > 100 ppb at 11 km, and stratospheric air removed WRF-Chem Inflow • Ouflow - No Scav. Outflow - Scav.
CO and O3 vertical structure is represented by model and affected little by wet scavenging CO O3 Observed (Preliminary) Inflow Outflow WRF-Chem Inflow • Ouflow - No Scav. Outflow - Scav.
CH2O enhanced in outflow, H2O2 scavenged CH2O H2O2 Observed (Preliminary) Inflow Outflow WRF-Chem Inflow • Ouflow - No Scav. Outflow - Scav.
Neu-PratherWetScavengingSchemein the 3 km WRF-Chemsimulation Summary Convective transport of non-soluble species is reasonably well represented by the 3 km WRF-Chem simulation Observed mean vertical profiles of some soluble species in outflow are better represented in the model with scavenging, while others are overly scavenged Currently implementing a more detailed scavenging scheme (Barth et al., 2001, 2007) role of ice (retention during freezing and adsorption of gases) Evaluation of lightning-NOx scheme being done by U. Maryland (Pickering, Allen, Cummings, Li)
Lightning Flash Rate Parameterization • Lightning-generated NO (LNOx) is an important emission in the upper troposphere where background NO is low • The production of LNOx depends on lightning flash rate, type of lightning, and NO produced • WRFV3.5 • flash rate parameterization is now in physics directory • NO production and emission is in chem directory • Able to evaluate lightning flash rate without overhead of running chemistry • Parameterizations available for both parameterized convection (Wong et al., 2013, GMD) and resolved convection (Barth et al., 2012, ACP)
Lightning Flash Rate Parameterizationin the 15 km WRF-Chem simulation 15 km CONUS: Grell 3D (G3) convective parameterization MOZARTchemistry, GOCART aerosols with radiative feedback
Lightning Prediction for Parameterized Convection FR = 3.44x10⁻⁵ ztop4.9 ztop = radar cloud top (20 dBZ height; agl) (Williams, 1985) ztop = level neutral buoyancy – 2 km (Wong et al., 2013) 500 moles NO/flash placed vertically following Ott et al. (2010) curves From Takahashi and Luo (2012) GRL CloudSat radar reflectivity profile of a tropical deep convective cloud observed on February 24 2007 over Amazon (unit: dBZ). The size of the system is about 140 km and the highest point is about 17 km.
May 29, 2012 DC3 Case Study Evaluation of Lightning Flash Rate Flash count for 2100-2200 UTC 35-40N, 95-100W, 2200-0100 UTC NLDN (obs of CG flashes) WRF NLDN WRF (mdl of IC+CG flashes) Limit flash rate to regions where 1. qtotmax> 0.5 g/kg 2. ppt > 5 mm/hr
Evaluation of Lightning Flash Rate 2200 UTC 29 May NLDN observations LNB only Qtot > 0.5 g/kg ppt > 5 mm/hr Spatial location and magnitude of flash rate better predicted when flash rate is restricted to regions of resolved cloud or high precipitation rates
Evaluation of Lightning Flash Rate 0000 UTC 30 May NLDN observations LNB only Qtot > 0.5 g/kg ppt > 5 mm/hr Spatial location and magnitude of flash rate better predicted when flash rate is restricted to regions of resolved cloud or high precipitation rates
Evaluation of Lightning Flash Rate 0200 UTC 30 May NLDN observations LNB only Qtot > 0.5 g/kg ppt > 5 mm/hr Spatial location and magnitude of flash rate better predicted when flash rate is restricted to regions of resolved cloud or high precipitation rates
May 29 Case Study Evaluation of NOx in Upper Troposphere ppt > 5 mm/hr Qtot > 0.5 g/kg Bkgd: WRF-Chem model results for NOx at z = 11 km and 00 UTC 30 May. Circles: GV and DC-8 observations of NOx at 10 < z < 12 km and 23-01 UTC Location is off somewhat (because of storm location), and magnitude is underpredicted
Summary • Restricting flash rate to regions of high precipitation or resolved cloud improves location and magnitude of flash rate • Next Steps • Finish tweaking flash rate parameterization • Evaluate with lightning mapping array data which gives total flash rate (= IC + CG) • Adjust NO production per flash • Use set up for simulating other DC3 cases at Δx = 15 km • Recommend refinement to the lightning flash rate parameterization for parameterized convection Thank you! DC3 is sponsored by the National Science Foundation (NSF), NASA, NOAA, and DLR DC3 Preliminary Data Provided by the following Instrument Teams: DC-8 CO: DACOM - G. Diskin, G. Sachse, J. Podolske (NASA/LaRC) DC-8 O3: CSD CL –T. Ryerson, I. Pollack, J. Peischl (NOAA/ESRL/CSD) GV CO, O3: CARI–A. Weinheimer, F. Flocke, T. Campos, D. Knapp, D. Montzka (NCAR) May 29, 2012 severe storm in northern Oklahoma (photo from Don MacGorman)