Download
1 / 2
20 likes | 134 Vues
Further Refinements and Testing of APEX (3.0): EPA’s Population Exposure Model for Criteria and Air Toxic Inhalation Exposures

E N D
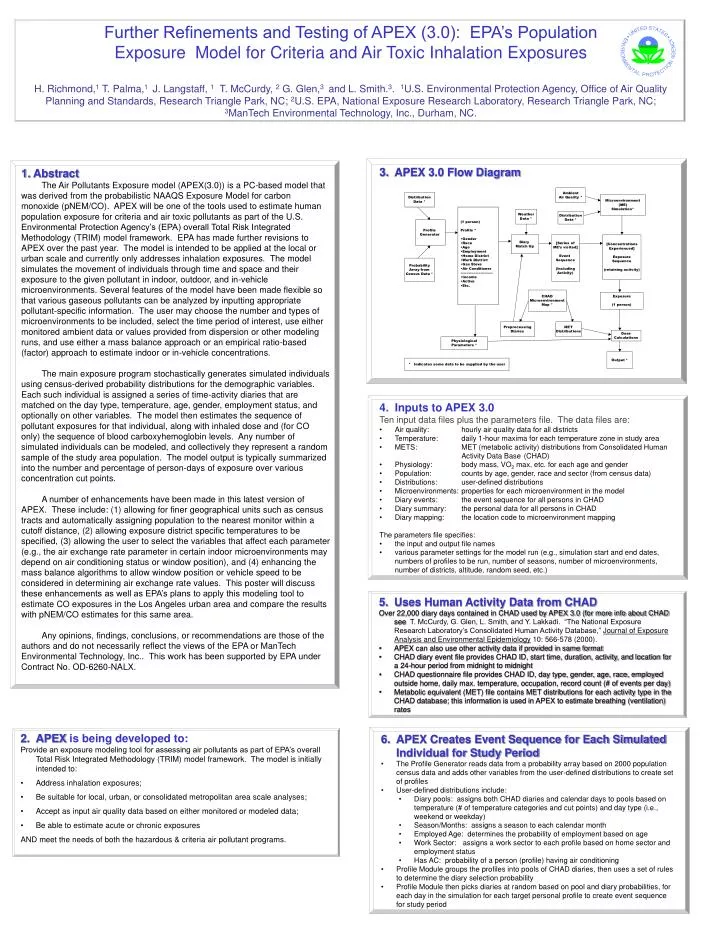
Further Refinements and Testing of APEX (3.0): EPA’s Population Exposure Model for Criteria and Air Toxic Inhalation Exposures H. Richmond,1 T. Palma,1 J. Langstaff, 1 T. McCurdy, 2 G. Glen,3 and L. Smith.3. 1U.S. Environmental Protection Agency, Office of Air Quality Planning and Standards, Research Triangle Park, NC; 2U.S. EPA, National Exposure Research Laboratory, Research Triangle Park, NC; 3ManTech Environmental Technology, Inc., Durham, NC. • APEX 3.0 Flow Diagram 1.Abstract The Air Pollutants Exposure model (APEX(3.0)) is a PC-based model that was derived from the probabilistic NAAQS Exposure Model for carbon monoxide (pNEM/CO). APEX will be one of the tools used to estimate human population exposure for criteria and air toxic pollutants as part of the U.S. Environmental Protection Agency’s (EPA) overall Total Risk Integrated Methodology (TRIM) model framework. EPA has made further revisions to APEX over the past year. The model is intended to be applied at the local or urban scale and currently only addresses inhalation exposures. The model simulates the movement of individuals through time and space and their exposure to the given pollutant in indoor, outdoor, and in-vehicle microenvironments. Several features of the model have been made flexible so that various gaseous pollutants can be analyzed by inputting appropriate pollutant-specific information. The user may choose the number and types of microenvironments to be included, select the time period of interest, use either monitored ambient data or values provided from dispersion or other modeling runs, and use either a mass balance approach or an empirical ratio-based (factor) approach to estimate indoor or in-vehicle concentrations. The main exposure program stochastically generates simulated individuals using census-derived probability distributions for the demographic variables. Each such individual is assigned a series of time-activity diaries that are matched on the day type, temperature, age, gender, employment status, and optionally on other variables. The model then estimates the sequence of pollutant exposures for that individual, along with inhaled dose and (for CO only) the sequence of blood carboxyhemoglobin levels. Any number of simulated individuals can be modeled, and collectively they represent a random sample of the study area population. The model output is typically summarized into the number and percentage of person-days of exposure over various concentration cut points. A number of enhancements have been made in this latest version of APEX. These include: (1) allowing for finer geographical units such as census tracts and automatically assigning population to the nearest monitor within a cutoff distance, (2) allowing exposure district specific temperatures to be specified, (3) allowing the user to select the variables that affect each parameter (e.g., the air exchange rate parameter in certain indoor microenvironments may depend on air conditioning status or window position), and (4) enhancing the mass balance algorithms to allow window position or vehicle speed to be considered in determining air exchange rate values. This poster will discuss these enhancements as well as EPA’s plans to apply this modeling tool to estimate CO exposures in the Los Angeles urban area and compare the results with pNEM/CO estimates for this same area. Any opinions, findings, conclusions, or recommendations are those of the authors and do not necessarily reflect the views of the EPA or ManTech Environmental Technology, Inc.. This work has been supported by EPA under Contract No. OD-6260-NALX. • Inputs to APEX 3.0 • Ten input data files plus the parameters file. The data files are: • Air quality: hourly air quality data for all districts • Temperature: daily 1-hour maxima for each temperature zone in study area • METS: MET (metabolic activity) distributions from Consolidated Human Activity Data Base (CHAD) • Physiology: body mass, VO2 max, etc. for each age and gender • Population: counts by age, gender, race and sector (from census data) • Distributions: user-defined distributions • Microenvironments: properties for each microenvironment in the model • Diary events: the event sequence for all persons in CHAD • Diary summary: the personal data for all persons in CHAD • Diary mapping: the location code to microenvironment mapping • The parameters file specifies: • the input and output file names • various parameter settings for the model run (e.g., simulation start and end dates, numbers of profiles to be run, number of seasons, number of microenvironments, number of districts, altitude, random seed, etc.) • Uses Human Activity Data from CHAD • Over 22,000 diary days contained in CHAD used by APEX 3.0 (for more info about CHAD see T. McCurdy, G. Glen, L. Smith, and Y. Lakkadi. “The National Exposure Research Laboratory’s Consolidated Human Activity Database,” Journal of Exposure Analysis and Environmental Epidemiology 10: 566-578 (2000). • APEX can also use other activity data if provided in same format • CHAD diary event file provides CHAD ID, start time, duration, activity, and location for a 24-hour period from midnight to midnight • CHAD questionnaire file provides CHAD ID, day type, gender, age, race, employed outside home, daily max. temperature, occupation, record count (# of events per day) • Metabolic equivalent (MET) file contains MET distributions for each activity type in the CHAD database; this information is used in APEX to estimate breathing (ventilation) rates • APEX Creates Event Sequence for Each Simulated Individual for Study Period • The Profile Generator reads data from a probability array based on 2000 population census data and adds other variables from the user-defined distributions to create set of profiles • User-defined distributions include: • Diary pools: assigns both CHAD diaries and calendar days to pools based on temperature (# of temperature categories and cut points) and day type (i.e., weekend or weekday) • Season/Months: assigns a season to each calendar month • Employed Age: determines the probability of employment based on age • Work Sector: assigns a work sector to each profile based on home sector and employment status • Has AC: probability of a person (profile) having air conditioning • Profile Module groups the profiles into pools of CHAD diaries, then uses a set of rules to determine the diary selection probability • Profile Module then picks diaries at random based on pool and diary probabilities, for each day in the simulation for each target personal profile to create event sequence for study period • 2. APEX is being developed to: • Provide an exposure modeling tool for assessing air pollutants as part of EPA’s overall Total Risk Integrated Methodology (TRIM) model framework. The model is initially intended to: • Address inhalation exposures; • Be suitable for local, urban, or consolidated metropolitan area scale analyses; • Accept as input air quality data based on either monitored or modeled data; • Be able to estimate acute or chronic exposures AND meet the needs of both the hazardous & criteria air pollutant programs.
Sector (census tract) Charlotte, NC CMSA District 2 District 3 District 5 District 1 Study area = 5 Districts District 4 = Ambient Fixed-site Monitor • Flexible Approach for Simulating Microenvironmental Concentrations • User defines number of microenvironments (ME) (up to 127) • Each ME can also be tagged as: at home, at work, or other • User provides input file that maps CHAD location codes into set of ME’s chosen (e.g., kitchen, living room, dining room location code in CHAD might all be assigned as “indoor residential” ME) • For each ME user decides between two types: factors or mass balance • Factors type - user must provide distributions for following factors: • Proximity factor: a multiplicative factor that represents relationship between air at nearest ambient monitoring site and air in immediate vicinity of ME • Penetration factor: multiplicative factor less than or equal to one • Sources: no limit on number of sources specified • Mass Balance type – user must provide distributions for following inputs: • Proximity factor (same as above) • Penetration factor: (same as above) • Sources: can be expressed as additive concentration (as above) or as emission rates (if specified as emission rates, then distributions of volumes for ME required) • Air exchange rate (AER): distributions expressed in air changes per hour • Decay ratefor pollutant: set to zero for nonreactive pollutants like CO • Microenvironmental Enhancements in APEX 3.0 • For a given microenvironmental parameter (MP) value the user may select up to three other variables that affect the selection of the value for the MP (e.g., AER may depend on A/C status) • Increased options for resampling for various parameters • User can choose to keep a parameter value constant for the entire simulation (e.g., house volume), or can specify that a new value shall be drawn hourly, daily, or seasonally from the appropriate distribution • Examples of microenvironmental parameters that can be resampled include: has a gas stove, gas stove emission rate, has residential a/c, has vehicle a/c, etc. • Allows user to model diurnal, weekly, or seasonal patterns for various microenvironmental parameters • The resample work option allows one to specify whether the same or new values should be used for microenvironmental parameters when the event sequence goes from a home sector to a work sector (e.g., car volume should be the same for an individual regardless of whether they are in their home or work sector) • Mapping options eliminate redundancy in entering input data • The mapping options collectively specify the cycles in the choice of distributions used to generate microenvironmental values. • Hours-Blocks tells the program about diurnal cycles • Weekday-Daytype mapping tells the program about weekly cycles • Month-Season, similarly defines seasonal cycles • District-Area mapping tells the program about parameters that vary on a geographic (district) basis • 8. Outputs from APEX 3.0 • Six output files (All in ASCII (text) format): • Log file: provides a report of highlights as the job progresses. Useful for debugging if the job stops abnormally and documenting input files and parameter settings used for a run. • Profile sumary: summary of each personal profile in the simulation, including age, gender, home & work sectors, air quality district for home & work • ME summary: summary for each ME for each person. Variables include number of minutes spent by each profile in the ME, & mean and maximum concentration in ME • Hourly exposure: contains hour-by-hour time series of exposure for each profile • Hourly dose: contains hour-by-hour times series of dose (%COHb in blood) for each profile (model currently addresses dose estimates only for CO) • Output Tables: contains a series of summary tables for the model run • Principal Limitations and Caveats • Provides modeling framework that is heavily dependent on user provided inputs (e.g., ambient air quality, distributions for mass balance or factors approach, assignment of CHAD location codes to microenvironment types, etc.), thus, exposure estimates only as good as the quality of the inputs to the model • Uncertainty about season-long exposure event sequence because APEX 3.0 creates seasonal or year long sequence for a simulated individual by sampling human activity data from more than one subject • Currently does not capture very well human activities that are correlated and which can impact microenvironmental concentrations (e.g, cigarette smoking leading to individual opening window which impacts AER that affects amount of outdoor air penetrating to residence) • APEX 3.0 currently does not characterize separately uncertainty and variability • Initial model testing and evaluation are underway • Population, Air Quality, and Temperature Enhancements Included in APEX 3.0 • Geographical units for population are “sectors” and this version comes with a national file of sectors using the 65,443 census tracts with population data from the 2000 census • A national commuting database based on 1990 census data is provided which has been mapped onto the 2000 census tracts to provide home-to-work commuting flows • “District” refers to the geographical area represented by a given set of ambient air quality data (either based on a fixed-site monitor or output from an air quality model) • User can specify maximum radius distance from center of study area and can specify whether or not to include only sectors (e.g., census tracts) in certain counties • User also can specify maximum radius distance for each district and only sectors with population centroid within that distance will be included in that district • User can provide temperature category for each“temperature zone” within the “study area”and zones are created in same fashion as districts • 13.Future Development Activities • Nearer Term ( coming year): • Completion of further enhancements resulting in creation of APEX 3.1 by 12/02 • Enable resampling of source term distributions at different frequencies (e.g., gas stove emission rate sampled yearly but gas stove operation sampled hourly • Enhance flexibility for selecting source term distributions (e.g., allow multiplication or addition of distributions values to produce a distribution) • Allow two temperature variables (e.g., daily maximum and daily average) • Expand types of input distributions to allow user to define distributions using histogram-type data • Modify to allow pollutants expressed in terms of weight (e.g., metals) • Evaluation/comparison with pNEM/CO using Los Angeles study area and running APEX 3.1 with inputs matched as closely as possible by Fall 2002 • Test application with benzene • Refine model and inputs in response to evaluation findings. • Incorporate APEX 3.1 into TRIM.Expo computer framework, and initial test applications. • User's guidance and programmers guide documents & public release Longer Term (next couple of years) • Add ability to characterize uncertainty and variability separately, where appropriate • Provide GIS capabilities for creating study area and inputs to model and for displaying outputs of model • Develop more user friendly interface • Develop additional pre-processors to assist in preparing inputs to the model for various air pollutants • Relationship Between Sectors, Districts, and Study Area • 14. Peer Review U.S. EPA, Science Advisory Board Advisory. December 1999, Environmental Models Subcommittee. RTP, NC. • Documents, including TRIM.Expo technical support document, available at: www.epa.gov/ttn/atw/urban/trim/trimpg.html Publications T. Palma, A.B. Vasu, and R.G. Hetes, 1999. "Total Risk Integrated Methodology (TRIM),” Air and Waste Management Association - EM March 1999, pp. 30-34.