Download
1 / 1
10 likes | 96 Vues
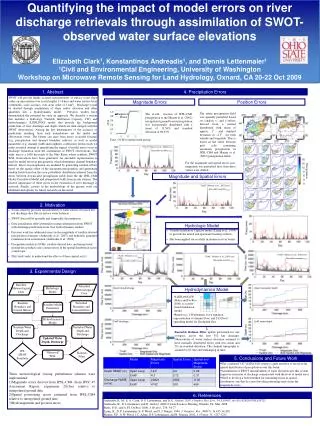
VERIFICATION OF A DOWNSCALING SEQUENCE APPLIED TO MEDIUM RANGE METEOROLOGICAL PREDICTIONS FOR GLOBAL FLOOD PREDICTION Nathalie Voisin, Andy W. Wood and Dennis P. Lettenmaier Civil and Environmental Engineering 2007 AGU Fall Meeting H23F-1682

E N D
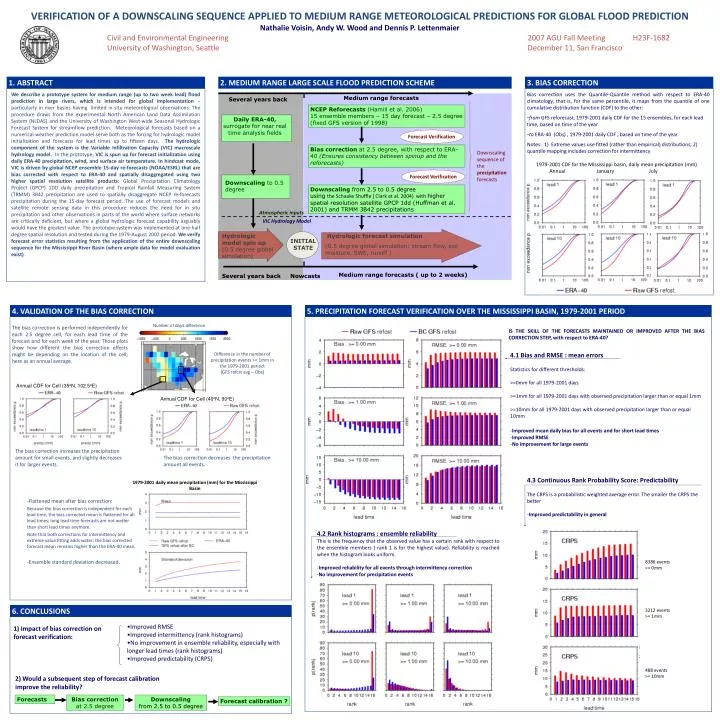
VERIFICATION OF A DOWNSCALING SEQUENCE APPLIED TO MEDIUM RANGE METEOROLOGICAL PREDICTIONS FOR GLOBAL FLOOD PREDICTION Nathalie Voisin, Andy W. Wood and Dennis P. Lettenmaier Civil and Environmental Engineering 2007 AGU Fall Meeting H23F-1682 University of Washington, Seattle December 11, San Francisco 1. ABSTRACT 2. MEDIUM RANGE LARGE SCALE FLOOD PREDICTION SCHEME 3. BIAS CORRECTION We describe a prototype system for medium range (up to two week lead) flood prediction in large rivers, which is intended for global implementation – particularly in river basins having limited in situ meteorological observations. The procedure draws from the experimental North American Land Data Assimilation System (NLDAS) and the University of Washington West-wide Seasonal Hydrologic Forecast System for streamflow prediction. Meteorological forecasts based on a numerical weather prediction model serve both as the forcing for hydrologic model initialization and forecasts for lead times up to fifteen days. The hydrologic component of the system is the Variable Infiltration Capacity (VIC) macroscale hydrology model. In the prototype, VIC is spun up for forecast initialization using daily ERA-40 precipitation, wind, and surface air temperature. In hindcast mode, VIC is driven by global NCEP ensemble 15-day re-forecasts (NOAA/ESRL) that are bias corrected with respect to ERA-40 and spatially disaggregated using two higher spatial resolution satellite products: Global Precipitation Climatology Project (GPCP) 1DD daily precipitation and Tropical Rainfall Measuring System (TRMM) 3B42 precipitation are used to spatially disaggregate NCEP re-forecasts precipitation during the 15-day forecast period. The use of forecast models and satellite remote sensing data in this procedure reduces the need for in situ precipitation and other observations in parts of the world where surface networks are critically deficient, but where a global hydrologic forecast capability arguably would have the greatest value. The prototype system was implemented at one-half degree spatial resolution and tested during the 1979-August 2002 period. We verify forecast error statistics resulting from the application of the entire downscaling sequence for the Mississippi River Basin (where ample data for model evaluation exist) . • Bias correction uses the Quantile-Quantile method with respect to ERA-40 climatology, that is, for the same percentile, it maps from the quantile of one cumulative distribution function (CDF) to the other: • from GFS reforecast, 1979-2001 daily CDF for the 15 ensembles, for each lead time, based on time of the year • to ERA-40 (Obs) , 1979-2001 daily CDF , based on time of the year Notes: 1) Extreme values use fitted (rather than empirical) distributions; 2) quantile mapping includes correction for intermittency Several years back Medium range forecasts NCEP Reforecasts (Hamill et al. 2006)15 ensemble members – 15 day forecast – 2.5 degree (fixed GFS version of 1998) Daily ERA-40, surrogate for near real time analysis fields Forecast Verification Bias correction at 2.5 degree, with respect to ERA-40 (Ensures consistency between spinup and the reforecasts) Downscaling sequence of the precipitation forecasts 1979-2001 CDF for the Mississippi basin, daily mean precipitation (mm) Annual January July Forecast Verification Downscaling to 0.5 degree Downscalingfrom 2.5 to 0.5 degree using the Schaake Shuffle ( Clark et al. 2004) with higher spatial resolution satellite GPCP 1dd (Huffman et al. 2001) and TRMM 3B42 precipitations Atmospheric inputs VIC Hydrology Model Hydrologic model spin up (0.5 degree global simulation) Hydrologic forecast simulation INITIALSTATE (0.5 degree global simulation: stream flow, soil moisture, SWE, runoff ) Several years back Nowcasts Medium range forecasts ( up to 2 weeks) 4. VALIDATION OF THE BIAS CORRECTION 5. PRECIPITATION FORECAST VERIFICATION OVER THE MISSISSIPPI BASIN, 1979-2001 PERIOD Number of days difference The bias correction is performed independently for each 2.5 degree cell, for each lead time of the forecast and for each week of the year. Those plots show how different the bias correction effects might be depending on the location of the cell, here as an annual average. IS THE SKILL OF THE FORECASTS MAINTAINED OR IMPROVED AFTER THE BIAS CORRECTION STEP, with respect to ERA-40? Difference in the number of precipitation events >= 1mm in the 1979-2001 period: (GFS refcst avg – Obs) • 4.1 Bias and RMSE : mean errors • Statistics for different thresholds: • >=0mm for all 1979-2001 days • >=1mm for all 1979-2001 days with observed precipitation larger than or equal 1mm • >=10mm for all 1979-2001 days with observed precipitation larger than or equal 10mm • Improved mean daily bias for all events and for short lead times • Improved RMSE • No improvement for large events Annual CDF for Cell (35oN, 102.5oE) Annual CDF for Cell (40oN, 90oE) The bias correction increases the precipitation amount for small events, and slightly decreases it for larger events. The bias correction decreases the precipitation amount all events. • 4.3 Continuous Rank Probability Score: Predictability • The CRPS is a probabilistic weighted average error. The smaller the CRPS the better • Improved predictability in general 1979-2001 daily mean precipitation (mm) for the Mississippi Basin • Flattened mean after bias correction: Because the bias correction is independent for each lead time, the bias corrected mean is flattened for all lead times; long lead time forecasts are not wetter than short lead times anymore. Note that both corrections for intermittency and extreme value fitting adds water; the bias corrected forecast mean remains higher than the ERA-40 mean. -Ensemble standard deviation decreased. • 4.2 Rank histograms : ensemble reliability • This is the frequency that the observed value has a certain rank with respect to the ensemble members ( rank 1 is for the highest value). Reliability is reached when the histogram looks uniform. • Improved reliability for all events through intermittency correction • No improvement for precipitation events 8386 events >= 0mm 6. CONCLUSIONS 3212 events >= 1mm • Improved RMSE • Improved intermittency (rank histograms) • No improvement in ensemble reliability, especially with longer lead times (rank histograms) • Improved predictability (CRPS) 1) Impact of bias correction on forecast verification: 488 events >= 10mm 2) Would a subsequent step of forecast calibration improve the reliability? Forecasts Bias correction at 2.5 degree Downscaling from 2.5 to 0.5 degree Forecast calibration ?