Download
1 / 26
260 likes | 390 Vues
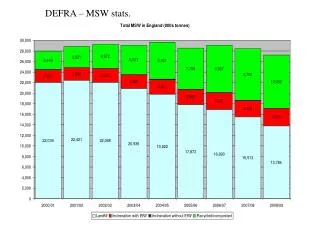
Stats & GIS. Spring 2009. OAK-examples.mxd. LOOK!. 1 std dev. Mean=0.43. Why does ArcGIS switch to a two color scale when I use standard deviation?. What about Bivariate Questions?. Median % vacant is about 3.5% (in 2000). Owner Occupancy and Vacancy. Median owner occupancy was ~36%

E N D
Stats & GIS Spring 2009
LOOK! 1 std dev Mean=0.43
Why does ArcGIS switch to a two color scale when I use standard deviation?
Owner Occupancy and Vacancy • Median owner occupancy was ~36% • Median vacant unit rate was ~3.5% • Can I map above and below on both variables?
It turns out that… • “TRUE” = -1 • “False” = 0
And so I can create a new field and code it … • If %VAHU<median add zero • If % VAHU>median add one • If %OOHU<median add zero • If %OOHU>median add two