Download
1 / 14
140 likes | 166 Vues
Explore how PHENIX experiment at Brookhaven Lab adopted ROOT for online monitoring, offline analysis, accessing raw data, and analyzing DSTs. Discover the pmonitor framework for multi-threaded online monitoring and analysis.

E N D
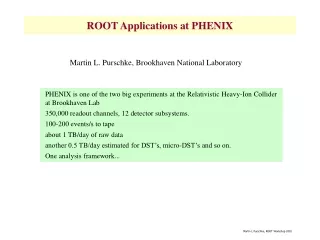
ROOT Applications at PHENIX Martin L. Purschke, Brookhaven National Laboratory PHENIX is one of the two big experiments at the Relativistic Heavy-Ion Collider at Brookhaven Lab 350,000 readout channels, 12 detector subsystems. 100-200 events/s to tape about 1 TB/day of raw data another 0.5 TB/day estimated for DST’s, micro-DST’s and so on. One analysis framework...
ROOT in PHENIX PHENIX has adopted ROOT early on, as early as 1997. After some short-lived detours (ROOT only in online, STAF in offline), virtually everything is done in a ROOT framework now. We use ROOT for online monitoring, offline analysis, accessing raw data, writing and analyzing DST’s. Of the above, online monitoring is the most demanding. We use the online monitoring package, called pmonitor, also for offline work (it doesn’t hurt that the offline package has all the online power under its hood, and it cuts down on maintenance burden.) All the low-level libraries are common anyway. • the PHENIX Event libraries, gives access to the data • Introduce pmonitor, and a quick demo • The messaging system • Experiences • The short wishlist
Detectorelement Detectorelement Detectorelement Packet Packet Packet PHENIX Event Libraries The PHENIX Event libraries give access to all aspects of the Phenix raw data the biggest single “monolithic” PHENIX-specific class library Shield the user from all nitty-gritty, and provides a logical view of detector elements helps the expert to access low-level details for debugging fully interfaced with ROOT, but works also in non-ROOT programs A packet knows all about the detector element (a readout board typically) and can provide the user with the “value of channel i” Event Packet *p = e->getPacket(1003); h2->Fill (p->iValue(0), p->iValue(1) ); If you think of the readout card as a multi-channel ADC, this retrieves the channel 0 and 1, independent from what the hardware looked like and how the data are encoded internally. Your code won’t depend on those details. Each detector element has been assigned a unique packet id.
fileEventiterator etEventiterator Eventiterator testEventiterator Data streams Phenix has several types of data streams, which are handled by a Eventiterator class. Reads from a raw data file Reads from an online data poolfor online monitoring Makes test events with known properties up from scratch Eventiterator *it = new fileEventiterator(”datafile.prdfz”); Event *e; while (e = it->getNextEvent() ) { // do something with it… delete e; } delete it;
pmonitor, the PHENIX analysis framework pmonitor is the framework we use for online monitoring, as well as for offline analysis. It relieves the user of repetitive tasks it provides access to the data through all kinds of event streams implements the event loop and hooks for special events, such as begin-run and end-run It is “lean” -- not burdened with features. Features can be added by specific applications built on top of pmonitor. But the best is - it is multithreaded. On Thu, 13 Mar 1997 12:15:08 -0500 (EST) Martin Purschke wrote: Dear Rene, as you know, we -- that is Phenix for me now :-) -- are evaluating root's capabilities for our online monitoring. In this case you want to have the prompt (or some other user interface) active all the time, while the event loop or other process is running in the background. So without stopping that, you want to bring up different histograms on your canvas, or make fits, or whatever. I looked through the manuals and tried all the GUI examples, but they are single-threaded, that is, inactive until the currently executing macro or function terminates. Are there any multi-threaded capabilities in root, or is this just not available? Thanks for any hints. Cheers, Martin Victor Perevoztchikov, BNL Marc Hemberger, GSI Rene & Fons
Check for user command prompt/GUI Check for user command prompt/GUI That’s what you had to do before That’s what you do now Get Next Event Get Next Event Analyze event Analyze event Multi-threaded ROOT online monitoring • For online monitoring, you want to work with your histograms, display them at will, clear them, fit them, store them, whatever, while they are being filled in the background by your monitoring task. • In your flow of control, say for GUI’s, you don’t need to bother with the Event loop - that’s the background thread. • You don’t stop the event loop to check for commands. The good old days of multi-process PAW are back.
The pmonitor framework • We solidified the multi-threaded analysis capability into the easy-to-use pmonitor framework. • In its simplest form, you provide 2 functions • int pinit() -- initialize, book histos, read the database, open files, etc. • int process_event (Event * evt) -- process an event, which is delivered by the framework. • This is the top-level entry to your analysis -- you are free to call or make whatever function or whatever object is needed for the analysis. • You do not need to worry about • opening data streams • starting the event loop for all or a given number of events • selecting events • Storing histograms and other things Now, without further delay...
Sorry folks This is where in the real talk I gave a demonstration. You can’t see it here, just some pictures
A real-life example Our Electromagnetic Calorimeter has about 26,000 photomultiplier channels. They get gain-monitored through laser pulses, which should always give the same signal or the gain is off. We compute running means of these laser events and compare the current running mean to a reference value. Et Pool Data file etEventiterator EmCal- pmonitor project This looks like the actual DAQ We had last year 180 packets with 144 channels each, packets 8001 through 8180. The following EmCal monitor project read mean reference values from the database, calculates the running means for all channels, and compares actual to the reference values
Sorry Folks... This is where in the real talk I gave a demonstration. You can’t see it here...
A Messaging System You have seen the “Total number of bad channels: 97” messages. They are nice, but not very useful unless someone pays attention. That’s where our messaging system comes in. At a system level, we capture ALL output, and dispatch it according to a message profile to a CORBA server, which delivers the message to its destinations. One of the design goals was to have the regular “cout <<“ interface, no special “msg_something(…)” call. The past has shown that users still use cout or printf. Our system sees all messages, so in a batch operation, no crucial messages can end up in a obscure logfile if the user just typed “cout << “Our detector is burning!!!!” << endl;” The user can tag a message with type, origin, severity to classify the message. void showBadChannels(const double deviation) { msg_control *emc = new msg_control(MSG_TYPE_MONITORING, MSG_SOURCE_PBGL, MSG_SEV_WARNING,"EmCal Monitor"); /// stuff deleted cout << *emc << " Total number of bad channels: " << count << endl;
Retrieving Messages Any number of users and automated processes can then contact the message system and subscribe to the kind of messages they are interested in, for example “anything from EmCal that’s a warning or higher” (that would get you the previous message) “anything that’s from detector monitoring and an error or higher” “anything that’s from the HV system” We also have a severity “Immediate Shift Crew Attention” that gets you just that. Everything is logged, anyone can get the mix of messages he is interested in. With a widely distributed Online system (some 600 processes), this is the only way we can manage messages. I can’t actually show it here because I don’t have right infrastructure here with CORBA and all. I can show a simpler system, though...
Experiences We have made a nice framework that’s easy for the user to get started and focused on the task at hand (the monitoring/analysis) Has won wide and immediate acceptance used for online monitoring, raw data offline analysis, and DST analysis (haven’t shown DST analysis here) very stable for raw data analysis and DST production. We hit a few potholes with with the 2.25->3.00* transition, couldn’t read 2.25-generated root trees (fixed with 3.01.*) Threads work out ok - there is a general problem with X displays from a thread, not ROOT-related, we said we would look into it, but don’t have time to do it now. Threads get hit by the “ROOT common blocks”. With file->cd() and then someobject->Write() there is no direct connection between the two except through the global cwd, and Threads can interfere with each other.
Suggestion: Collect “useful stuff” of general functionality and distribute if from the Web or put select stuff in $ROOTSYS/macros. Even in PHENIX we see simple things re-invented. Flavor: the macro to automatically add a preview to EPS, stuff like that. Wishlist Perform [more realistic] compatibility checks when upgrading versions; e.g two root trees with a variety of data types (inluding long long), written on machines of both endianess; see that you can still read both. Advertise changes in the class hierarchy more - e.g., some recent changes in TBranchObject / TBranchElement Automake/autoconf would go a long way to catch the problems we saw recently (but that’s not new, right?) What is it that prevents gif’s from being produced in batch (-b) mode? I can work around, but it would be nice to easily produce Web pages offline (our monitoring processes do that).