Download
1 / 10
100 likes | 212 Vues
Hypothesis tests De-mystified. 5 steps. 1. State the null and alternative hypothesis 2. Select the distribution to use 3. Determine the rejection and non-rejection regions 4. Calculate the value of the test statistic 5. Make a decision

E N D
5 steps • 1. State the null and alternative hypothesis • 2. Select the distribution to use • 3. Determine the rejection and non-rejection regions • 4. Calculate the value of the test statistic • 5. Make a decision So let’s look at each of these steps and learn to ask intelligent questions in each one…
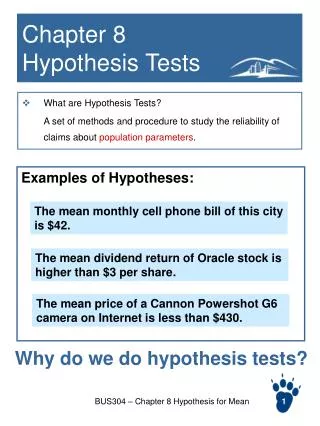
1. State the Null and Alt. Hypothesis • Somewhere in the problem there will be a statement about a mean or proportion that claims that it is a particular value. It could say that the parameter “is” or “is equal to” or “at least” or “at most.” This is always your Null hypothesis. • There will also be a statement which suggests that the Null is incorrect. This is your alternate Hypothesis. Although it may or may not specify how, you can make this determination by taking the Null and this claim together. • The number (mean or proportion) stated in in the Null will be the same as the one in the Alternative.
1. State the Null and Alt. Hypothesis • For example- • My Dad thinks that it takes 10 minutes or less (on average) to clean up the kitchen. I want to test this claim • This example is difficult, because I only made one statement. However, that statement can guide both my Null and Alt hypothesis. If my Dad thinks that it takes 10 min or less, he has made a statement about a parameter. Specifically, that the population mean is 10 or less so: • H0: m< 10 • The ONLY way I can disprove Dad’s claim is to find evidence that it takes longer than 10 min (on average) to do this. If It takes less than ten min, Dad is still correct. The only Alt. that works is: • H0: m > 10
Stuff to remember about hypothesis • 1. both null and alt Hypothesis are about population parameters m and p. NEVER sample stats. • 2. The number in the Null is the number in the Alt. • 3. the Null ALWAYS contains an “equals” the Alt NEVER does. • 4. The Null and Alt are what tells us if we have a one tail, right tail or left tail test
2. Select the distribution to use • There are only 2 choices here: • Standard Normal Distribution (z scores) • Students t distribution (t scores) • For the purposes of this class, we will decide which to use by looking at sample size. • If n > 30, we use z • If n < 30, we use t • If we are dealing with proportion, use z
3. Determine the critical region(s) • Stuff to ask: • Is this a two tailed (divide a by 2) or a one tailed (do not divide a) • If one tailed, which tail? Right tail = a positive critical value, Left tail = a negative critical value • Am I looking this up in the z table or the t? (refer to step 2) • This is going to give us a numerical cutoff between Rejection and Non-rejection.
4. Calculate the Test statistic • The test statistic (also called the observed value) is the data that we collect in the sample. It is a mean or proportion that we get from actually measuring a sample of elements. This is going to provide us with evidence (or lack thereof) for rejecting the Null. • SO…we take the “p-hat” or sample mean and make it into a Z or t score using the formula that you all know and love(if you do not know what I am talking about, you need to figure it out quick). • This Z or t score is what we are gonna compare with the critical value we just came up with in step 3. The bigger our test statistic, the more likely it is that we will reject the Null.
5. Make a decision • Here’s where our efforts are rewarded. By comparing the test statistic (from step 4) with the critical value (step 3) we can decide whether or not we can reject the Null. • If the test statistic is FARTHER AWAY from 0 than the critical value, we Reject the Null.
Decision • Remember: • We can never “Reject the Alternate Hypothesis” nor can we “Retain the Alternate” • We really only Reject the Null, or Retain (keep) the Null.