Download
1 / 62
620 likes | 739 Vues
Why by-plant resolutions will be necessary in precision agriculture. 1992, At What Resolution are there real biological differences. Paul Hodgen , Univ. Nebraska, Dissertation AA13271926, Jan 1, 2007. Target plant acquired over 70% of the total depleted 15N fertilizer that was taken up

E N D
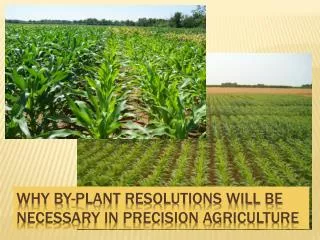
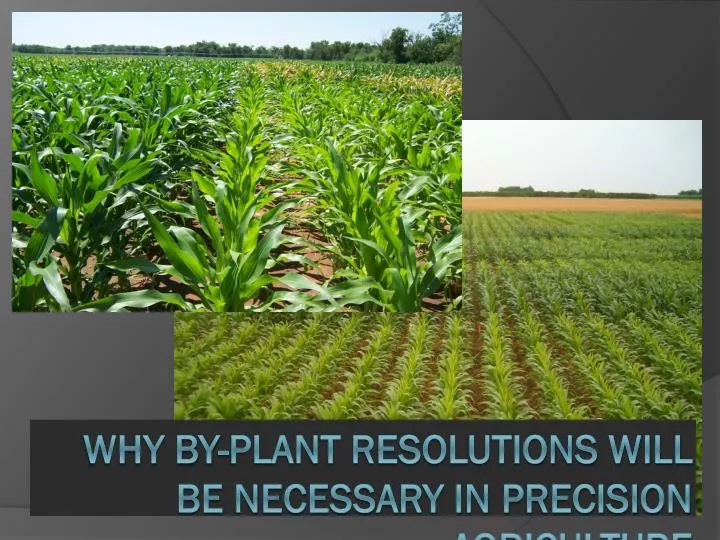
Why by-plant resolutions will be necessary in precision agriculture
1992, At What Resolution are there real biological differences
Paul Hodgen, Univ. Nebraska, Dissertation AA13271926, Jan 1, 2007 • Target plant acquired over 70% of the total depleted 15N fertilizer that was taken up • data revealed an individual corn plant acquires most of its N from within a radius of less than 0.5 m. • Timely emergence impacts a plant's potential to achieve maximum yield. • Plants lose yield potential by emerging as little as three days after their neighbors. • Large doses of N fertilizer could not increase the yield of late emerging corn plants. • Small spatial resolution N management techniques should be focused on determining the N demand of the early emerging plants.
Plant-to-plant variation, avg. 45 bu/acNebraska, Iowa, Virginia, Oklahoma, Argentina, Mexico, Ohio OKLAHOMA IOWA
Variable Rate TechnologyTreat Temporal and Spatial Variability Wheat, 0.4m2 Corn, by plant
Causes for Delayed and uneven emergence • •variable depth of planting • •double seed drops • •wheel compaction • •seed geometry within the furrow • •surface crusting • •random soil clods • •soil texture differences • •variable distance between seeds • •variable soil compaction around the seed • •insect damage • •moisture availability • •variable surface residue • •variable seed furrow closure • •volunteerearly season root pruning (disease, insect) • The impact of uneven stands takes place prior to the time that irrigation is employed whether using surface/furrow or center pivot systems.
34 ± 5.3 bu/ac 37 ± 9 bu/ac
Methods • A GreenSeeker Sensor was mounted on a bicycle • A shaft encoder was used to assign distance to each sensor reading • Readings were taken once per centimeter
Comprehensive work from transects sampled all over the world have shown that the average difference in corn grain yield when determined by plant, averaged 44 bu/ac. (Nebraska, Ohio, Virginia, Iowa, Mexico, and Argentina) • (http://nue.okstate.edu/Index_Publications/Plant_toPlant.htm). • Same results encountered in high and low yielding environments. • Variable plant-to-plant N fertilization is possible using commercially available sensing technology and advanced spraying systems • Agronomic research programs must deliver improved N management practices. This has become more important when considering that nitrogen use efficiencies are so low, all over the world.
Summary • No magic/transparent algorithm and methods • Embedded technology • Farmer fields in the USA, Argentina, and Mexico showed that over all sites, plant-to-plant variation in corn grain yield averaged 2765 kg ha-1 or 44.1 bu ac-1 (Martin et al., 2005). • Hodgen et al. (2007) showed that if corn plants are delayed by as little as four days, the yield depression of that individual delayed plant was as much as 15 percent
Outline • N Rich Strip • Need for different N rates each year • Algorithm Development (YP0-RI), SBNRC • Foliar P • Seed Orientation • Pocket Sensor • Hand Planter, 3rd world • Regional Corn, Regional Wheat • New by plant approach
Exp. 502 1971-2010, Winter Wheat Optimum N Rate Max Yield Avg. 59 lb N/ac +/- 47 Avg. 44 bu/ac +/- 15 Is 6 out of 40 years good enough?
Temperature/Moisture/pH • Fall applied N, w/wonitrosomonas inhibitors • Minnesota
Ramp Calibration Strip • Walk it off • Or use Hand-Held Sensor 0 N 195 N
Norman, NE, 1995-2008Avg. Range = 61 bu/ac 2010, 1.54 billion bushels, Nebraska 2009, 159 bu/ac
NDVI, V8 to V10 = CORN INSEY Days from planting to sensing
By-Plant Fertilizer Applicator • Fertilizing individual plants will require: • Sensing capability to locate plants, the proximity of neighboring plants, and yield potential of all plants • Calculating the desired fertilizer rate • Applying the desired amount of fertilizer within some (to be determined) constrained distance from the plant.
Seed Placement and Leaf Orientation Yield increase up to 27.1% and 30.6% (prostrate and erect hybrids respectively at pop 74,100 plants/ha) when compared to random placement
Previous Work • OSU developed and demonstrated a pressure based binary control system to apply nitrogen fertilizer at a sub meter scale. • 1x, 2x, and 4x nozzles are opened quickly in combinations to provide 7 distinct rates.
Drop Nozzles in Corn • The pressure based binary system was used in corn by dropping nozzles into the canopy. • TeeJet SJ-3 fertilizer nozzles were oriented parallel with the row at a 45 degree angle.
Moving to Individual Plants • This same concept can be used when fertilizing individual plants. • Since the system will maintain a near constant pressure, rate will be based on speed, orifice size, and pulse
Current approach of determine sensor-based in-season N fertilization • Predicting Mid-Season Yield Potential (YP0) • Predicting the Potential Response to Applied N • Yield Potential Achievable with Added N Fertilization (YPN) • Generating a Fertilizer N Rate Recommendation
Understanding the Algorithm • Why they work • Why they have weaknesses in certain regions • Why is the algorithm based on yield potential • Why predicting yield potential is going to be critical for N and other elements
Spectral Data Based on Reflectance Leaf Pigments Cell Structure Water Content Water Absorption Healthy Lignin and Tannins Water Absorption Damaged Cellulose Peak 970 Short Wave Infrared (1000-2500 nm) Visible Spectrum (400-700 nm) Near Infrared (700-1000 nm) Source: www.forestwatch.sr.unh.edu
Why by-plant resolutions will be necessary in precision agriculture • Fundamental principles • Expression of Variability • By-Plant Variability • Errors Associated with By-Plant Yield • Corn Grain Yields Averaged over Larger Scales • Errors in Corn Grain Yields from Larger Scales
Causes for the Large Differences in By-Plant Corn Grain Yields • Causes for Delayed and uneven emergence • variable depth of planting • double seed drops • wheel compaction • seed geometry within the furrow • surface crusting • random soil clods • soil texture differences • variable distance between seeds • variable soil compaction around the seed • insect damage • moisture availability • variable surface residue • variable seed furrow closure • volunteerearly season root pruning (disease, insect) • The impact of uneven stands takes place prior to the time that irrigation is employed whether using surface/furrow or center pivot systems.
Hand Planter • 34 million ha’s
Of the 159,531,007 hectares of maize in 2009, there were approximately 34,409,010 hectares in the developing world. Of that total, around 60% was planted by hand, representing just over 20,645,000 hectares or 13% of the total maize area in the world (www.faostat.org. Web 24 Sept. 2010).
If single seeds could be planted 14-17 cm apart, much like conventional planters accomplish in the developed world, production levels could easily increase 25%. • Despite the fact that third world maize yields are generally less than 2.0 Mg/ha (Dowswell et al., 1996), this 25% yield increase on 60% of the hand planted maize area in the third world would be worth more than 3 billion dollars/year (corn price at $0.3/kg) • 20,000,000 has * 2.0 Mg/ha *0.25 (% increase) *0.3